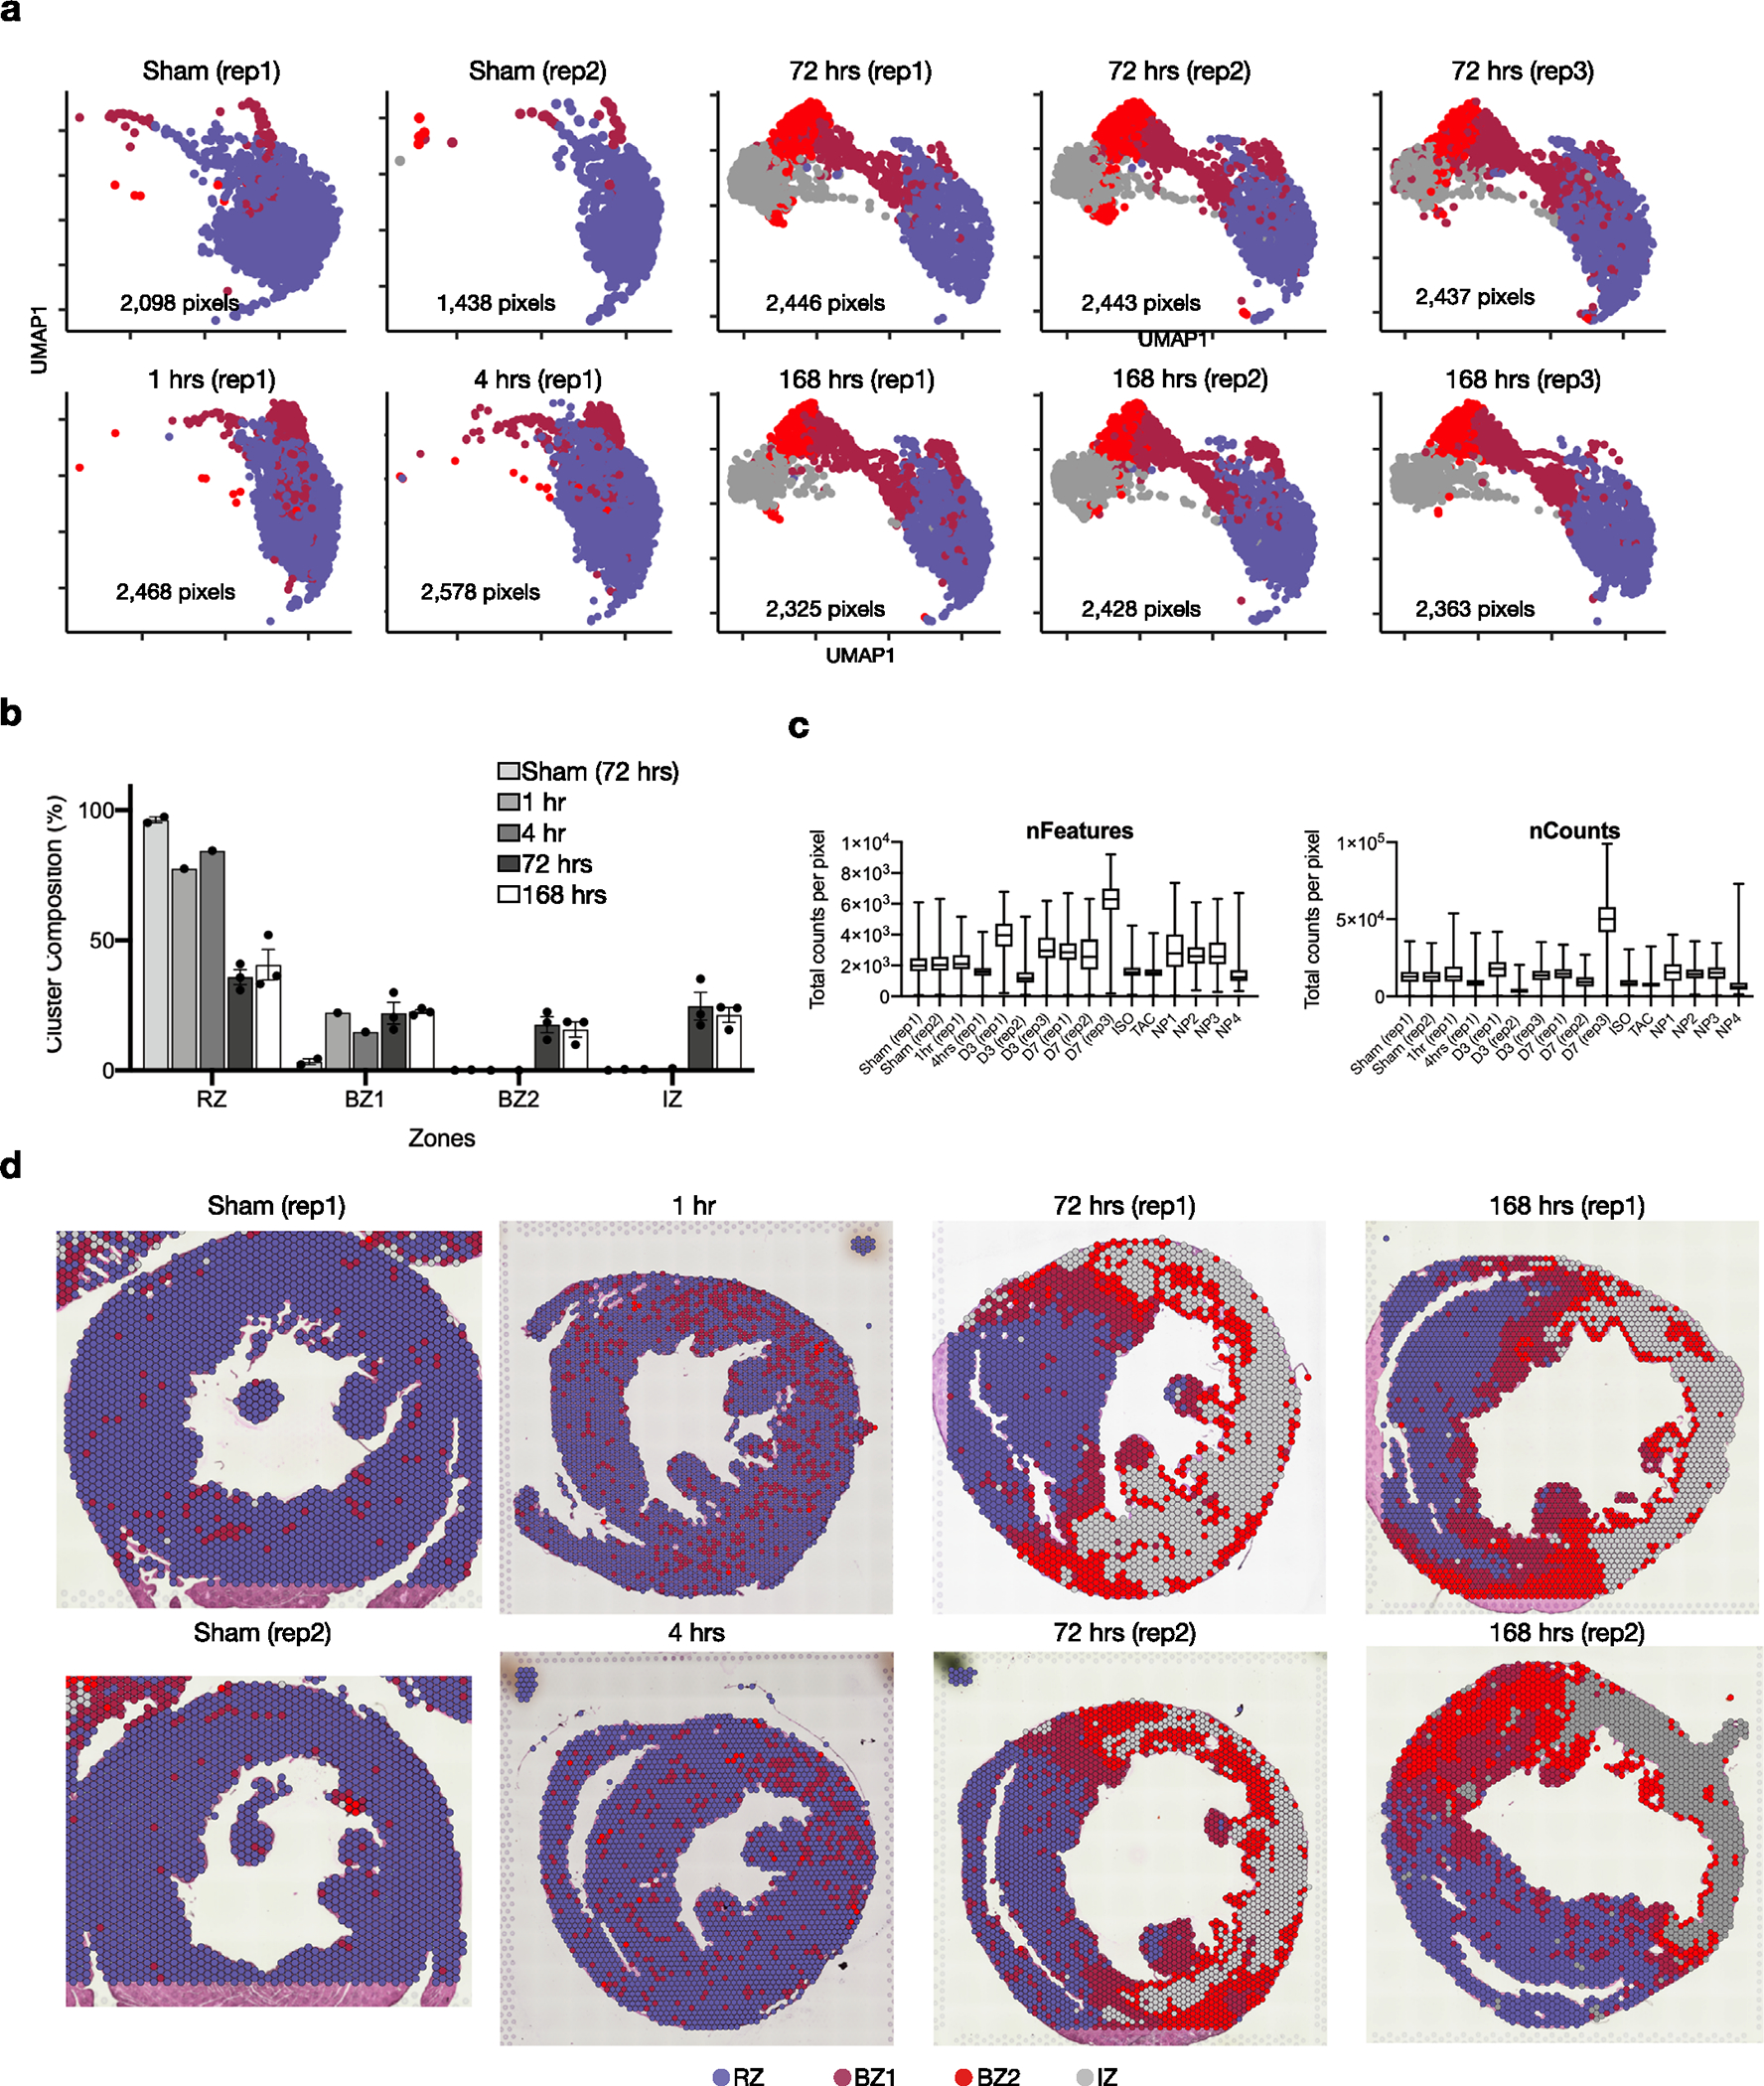
Extended Data Fig. 2 |. Integration and quantification of spatial transcriptomic datasets.

(a) UMAP plots split by sample. (b) Quantification of cluster classification as a percentage of total pixels captured by sample (data presented as mean values ± SEM; n = 2, sham; n = 1, 1 hr and 4hrs; n = 3, 72 hrs and 168hrs post-MI). (c) Quality control metrics, split by sample. (d) Spatial plot showing results of clustering across different time points after MI and replicates.
