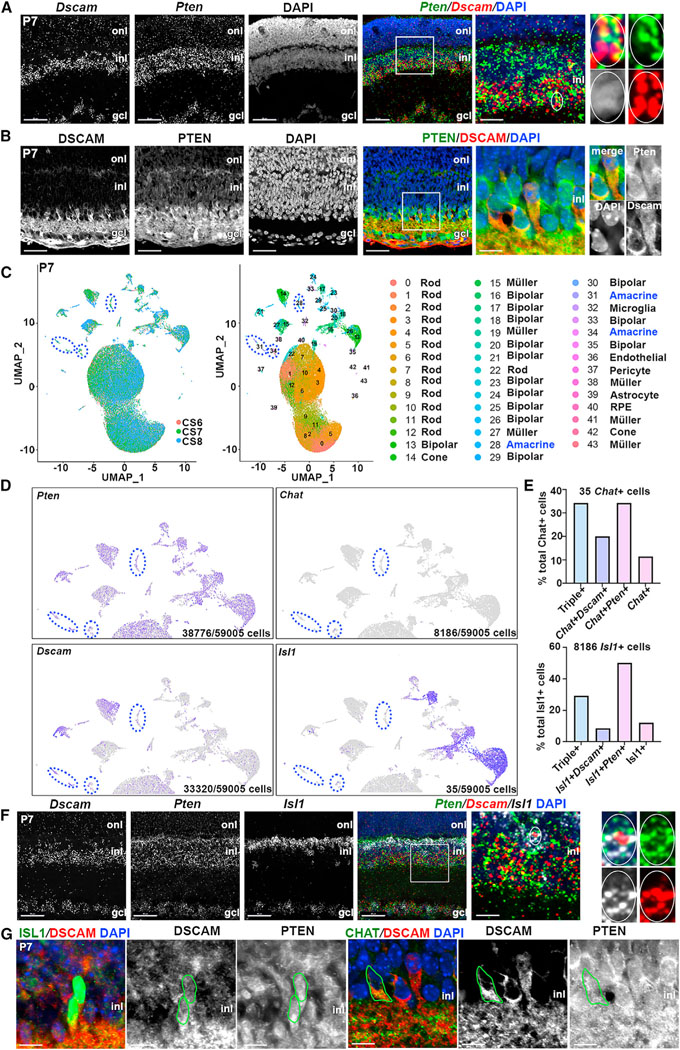
Figure 1. Pten and Dscam are co-expressed in cholinergic amacrine cells.

(A and B) RNAscope hybridization (A) and immunolabeling (B) of P7 retinas. High-magnification images on the right show colocalization of Dscam and Pten transcripts and proteins.
(C–E) UMAP of P7 retinal scRNA-seq data (N = 3), each sample indicated by a color code, and cluster identities (C). Pten, Dscam, Isl1, and Chat transcript distribution, with amacrine cell clusters circled in blue (D). Quantification of Chat+ and Isl1+ cells co-expressing Pten and Dscam (E).
(F) RNAscope of P7 retinas with Dscam, Pten, and Isl1 probes. High-magnification images on the right show colocalization of Dscam, Pten, and Isl1.
(G) Immunolabeling of P14 wild-type retina with PTEN, DSCAM, ISL1, and ChAT. Green circles outline ChAT+ and ISL1+ cells co-expressing PTEN and DSCAM. GCL, ganglion cell layer; INL, inner nuclear layer; ONL, outer nuclear layer.
Scale bars: 50 μm in the first four; 10 μm in high-magnification images. See Figure S1.
