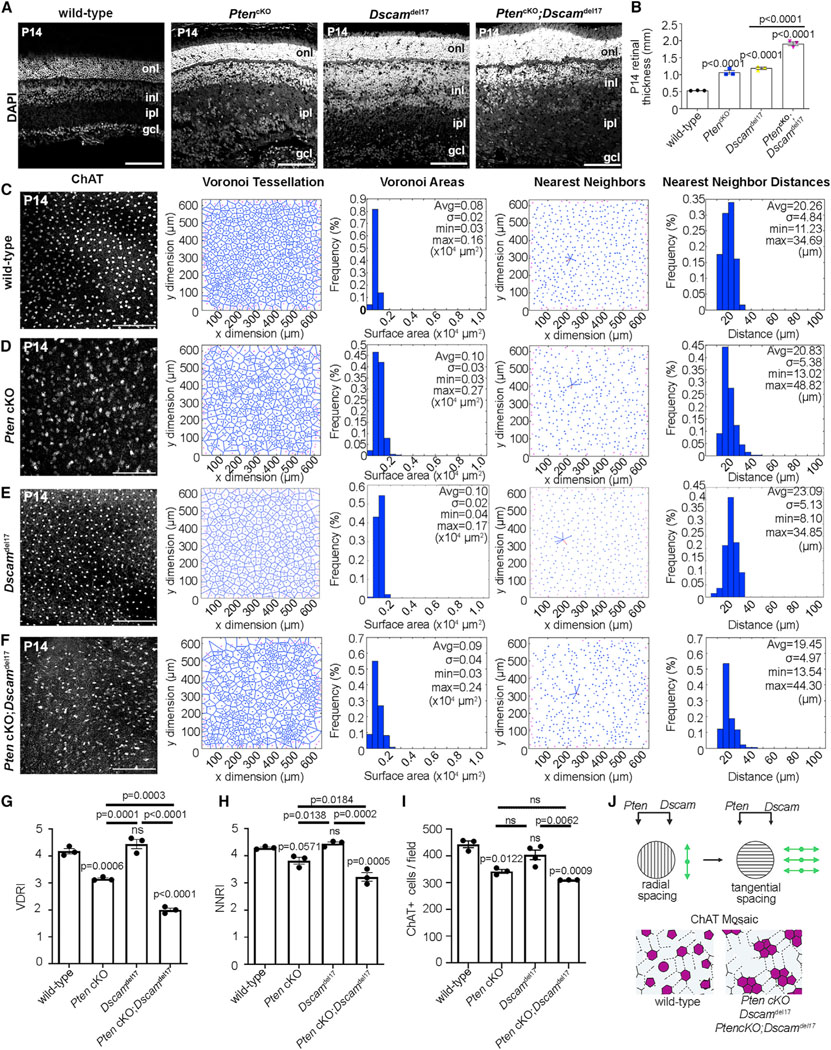
Figure 2. Aberrant cholinergic amacrine cell mosaics in Pten and Dscam single and double mutant retinas.

(A and B) DAPI staining of P14 wild-type, PtencKO, Dscamdel17, and PtencKO;Dscamdel17 retinal sections (A) and quantification of retinal thickness (B). Plot shows means ± SEM. N = 3 biological replicates per genotype, each with 3 technical replicates. The p values were calculated with one way ANOVA and post hoc Tukey test.
(C–H) ChAT immunolabeling and mosaic analysis of P14 wild-type (C), PtencKO (D), Dscamdel17 (E), and Pten;Dscam DKO (F) retinal flat-mounts showing Voronoi tessellations, Voronoi areas, nearest-neighbor plots, and frequency distributions for ChAT+ SACs in the INL. Shown is calculation of VDRI (G) and NNRI (H) and ChAT+ cell numbers per field.
(I) Plots show means ± SEM. N = 3 biological replicates/genotype, except N = 4 for Dscamdel17, all with 3 technical replicates. p values were calculated with one-way ANOVA and post hoc Tukey test.
(J) Summary of Pten and Dscam additive effects on amacrine cell radial and tangential migration.
Scale bars: 100 μm (A) and 200 μm (C–F). See Figures S2 and S3.
