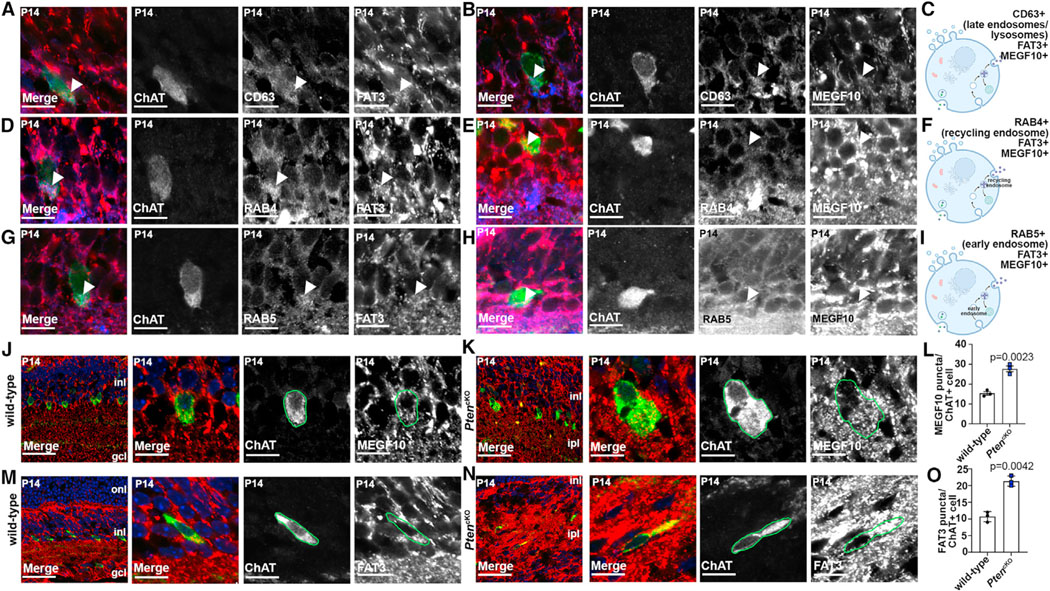
Figure 3. Co-localization of MEGF10 and FAT3 with ChAT is disrupted in PtencKO retinas.

(A–C) Colabeling of P14 wild-type retinas with CD63 (blue), ChAT (green), FAT3 (red, A), or MEGF10 (red, B). Arrows point to CD63 puncta that are positive for FAT3 or MEGF10. Also shown is a schematic of CD63+ endosomal compartments (C).
(D–F) Colabeling of P14 wild-type retinas with RAB4 (blue), ChAT (green), FAT3 (red, D), and MEGF10 (red, E). Arrows point to RAB4 puncta that are positive for FAT3 or MEGF10. Also shown is a schematic of RAB4+ endosomal compartments (F).
(G–I) Colabeling of P14 wild-type retinas with RAB5 (blue), ChAT (green), FAT3 (red, G) or MEGF10 (red, H). Arrows point to RAB5 puncta that are positive for FAT3 or MEGF10. Also shown is a schematic of RAB5+ endosomal compartments (I).
(J–O) Colabeling of P14 wild-type (J and M) and PtencKO (K and N) retinas with ChAT (green) and MEGF10 (red, J and K) or FAT3 (red, M and N). Blue is DAPI counterstain. Also shown is quantification of MEGF10+ (L) and FAT3+ (O) puncta in ChAT+ cell somata in wild-type and PtencKO retinas.
Plots show means ± SEM. N = 3 biological replicates/genotype, all with 3 technical replicates, with 50 total cells analyzed for wild-type and 48 cells for PtencKO. The p values were calculated with an unpaired t test. Scale bars: 10 μm (A–H), 40 μm (J–N in the first), and 10 μm in the remaining. See also Figure S4.
