
Figure 4. CAM endocytic recycling is accelerated in PtencKO retinas.
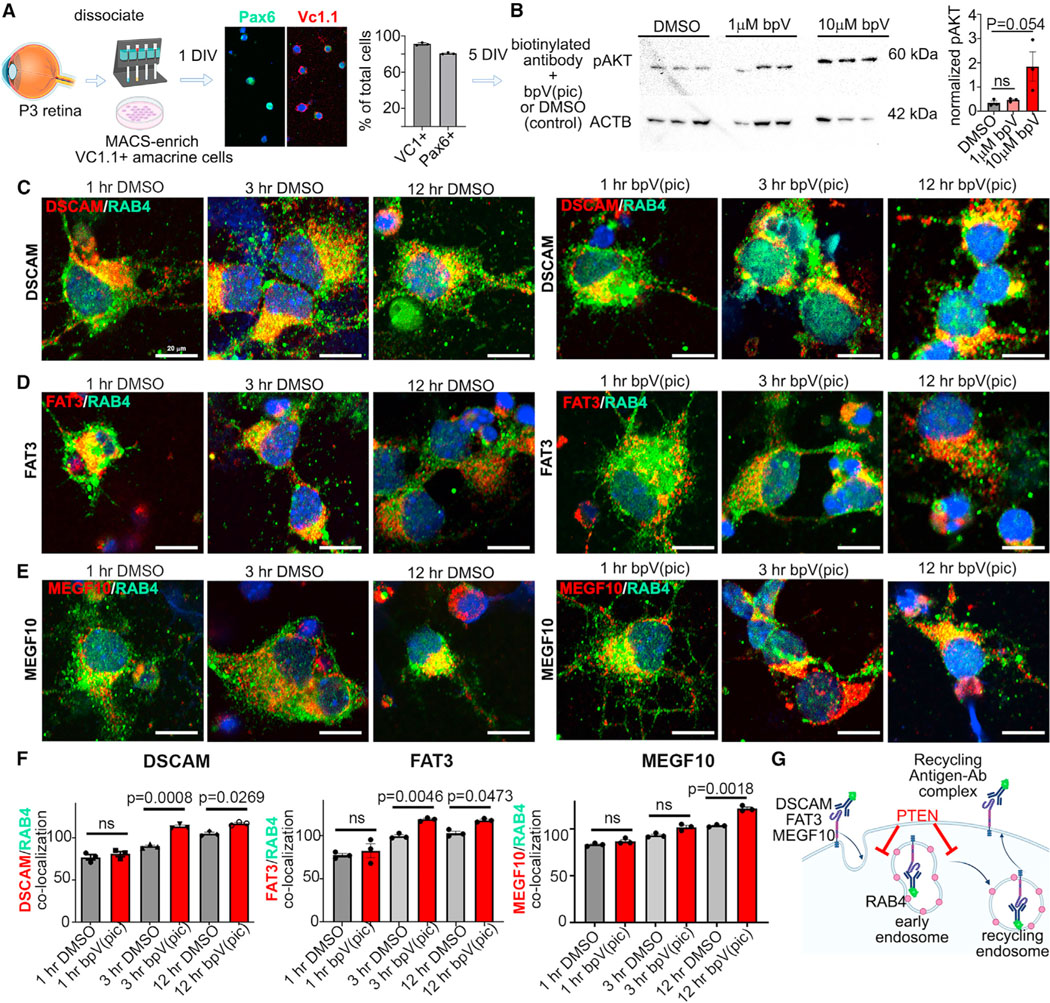
(A) Summary of the CAM endocytosis assay, showing immunolabeling and quantification of VC.1.1+ and Pax6+ MACS-enriched amacrine cells. Plots show means ± SEM. N = 3 biological replicates per sample from one experiment.
(B) Western blot of pAktSer473 in P7 retinal explants treated for 1 day with 1 μm or 10 μm bpV(pic). Densitometry is normalized to actin beta (ACTB). The plot shows means ± SEM. N = 3 biological replicates per sample from one experiment. p values were calculated with an unpaired t test.
(C–E) Immunolabeling of RAB4 with secondary antibodies to biotin-conjugated DSCAM (C), FAT3 (D), or MEGF10 (E) in MACS-enriched amacrine cells treated with DMSO or bpV(pic) for 1 h, 3 h, and 12 h.
(F) Quantification of the overlapping relative fluorescence signals of RAB4 with DSCAM, MEGF10, and FAT3. Plots show means ± SEM. 27–37 individual cells collected from 3 biological replicates were analyzed per time point and condition in 3 independent experiments. The p values were calculated with an unpaired t test in pairwise comparisons at each time point.
(G) Schematic highlighting how Pten affects endocytic trafficking.
Scale bars: 20 μm (C–E). See Figure S5.