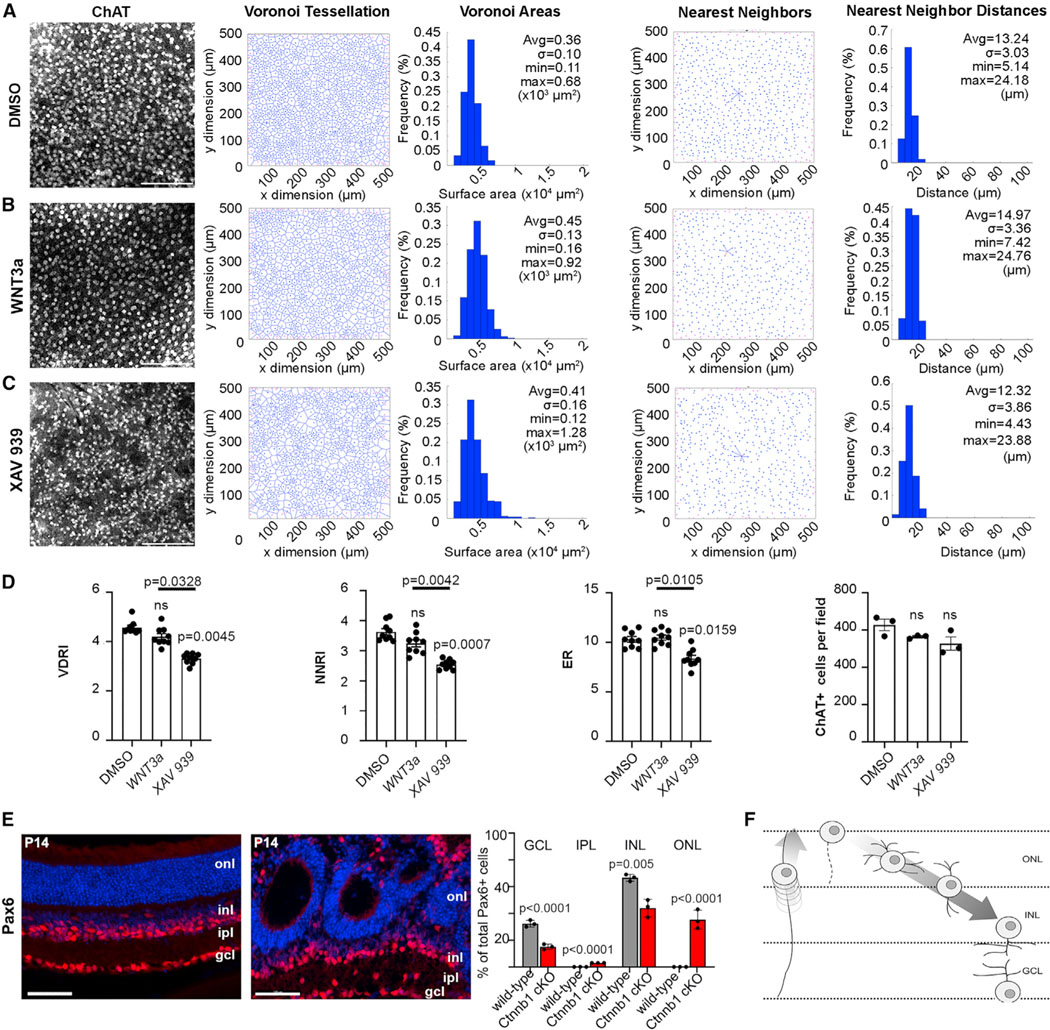
Figure 7. Perturbing Wnt signaling alters the spatial distribution of cholinergic amacrine cells.

(A–C) ChAT immunolabeling and mosaic analysis of retinal explants cultured with DMSO (A), Wnt3a (B), and XAV939 (C) (N = 6 each), showing Voronoi tessellations, Voronoi areas, nearest-neighbor plots, and frequency distributions for ChAT+ SACs.
(D) Voronoi domain RI (VDRI) and nearest-neighbor RI (NNRI), effective radius (ER), and ChAT+ cell numbers in retinal explants cultured with DMSO, Wnt3a, and XAV939. Plots show means ± SEM. N = 3 biological replicates, each with 3 technical replicates in one experiment. The p values were calculated with one-way ANOVA and post hoc Tukey test.
(E) Pax6 immunolabeling and quantification of P14 wild-type and Ctnnb1cKO retinas, showing ectopic Pax6+ cells in the IPL and ONL in Ctnnb1cKO retinas. Plots show means ± SEM. N = 3 biological replicates, each with 3 technical replicates in one experiment. The p values were calculated with an unpaired t test in pairwise comparisons.
(F) Schematic of the radial migration route of newborn amacrine cells. Scale bars: 50 μm (A–C) and 100 μm (F). See also Figure S7.
