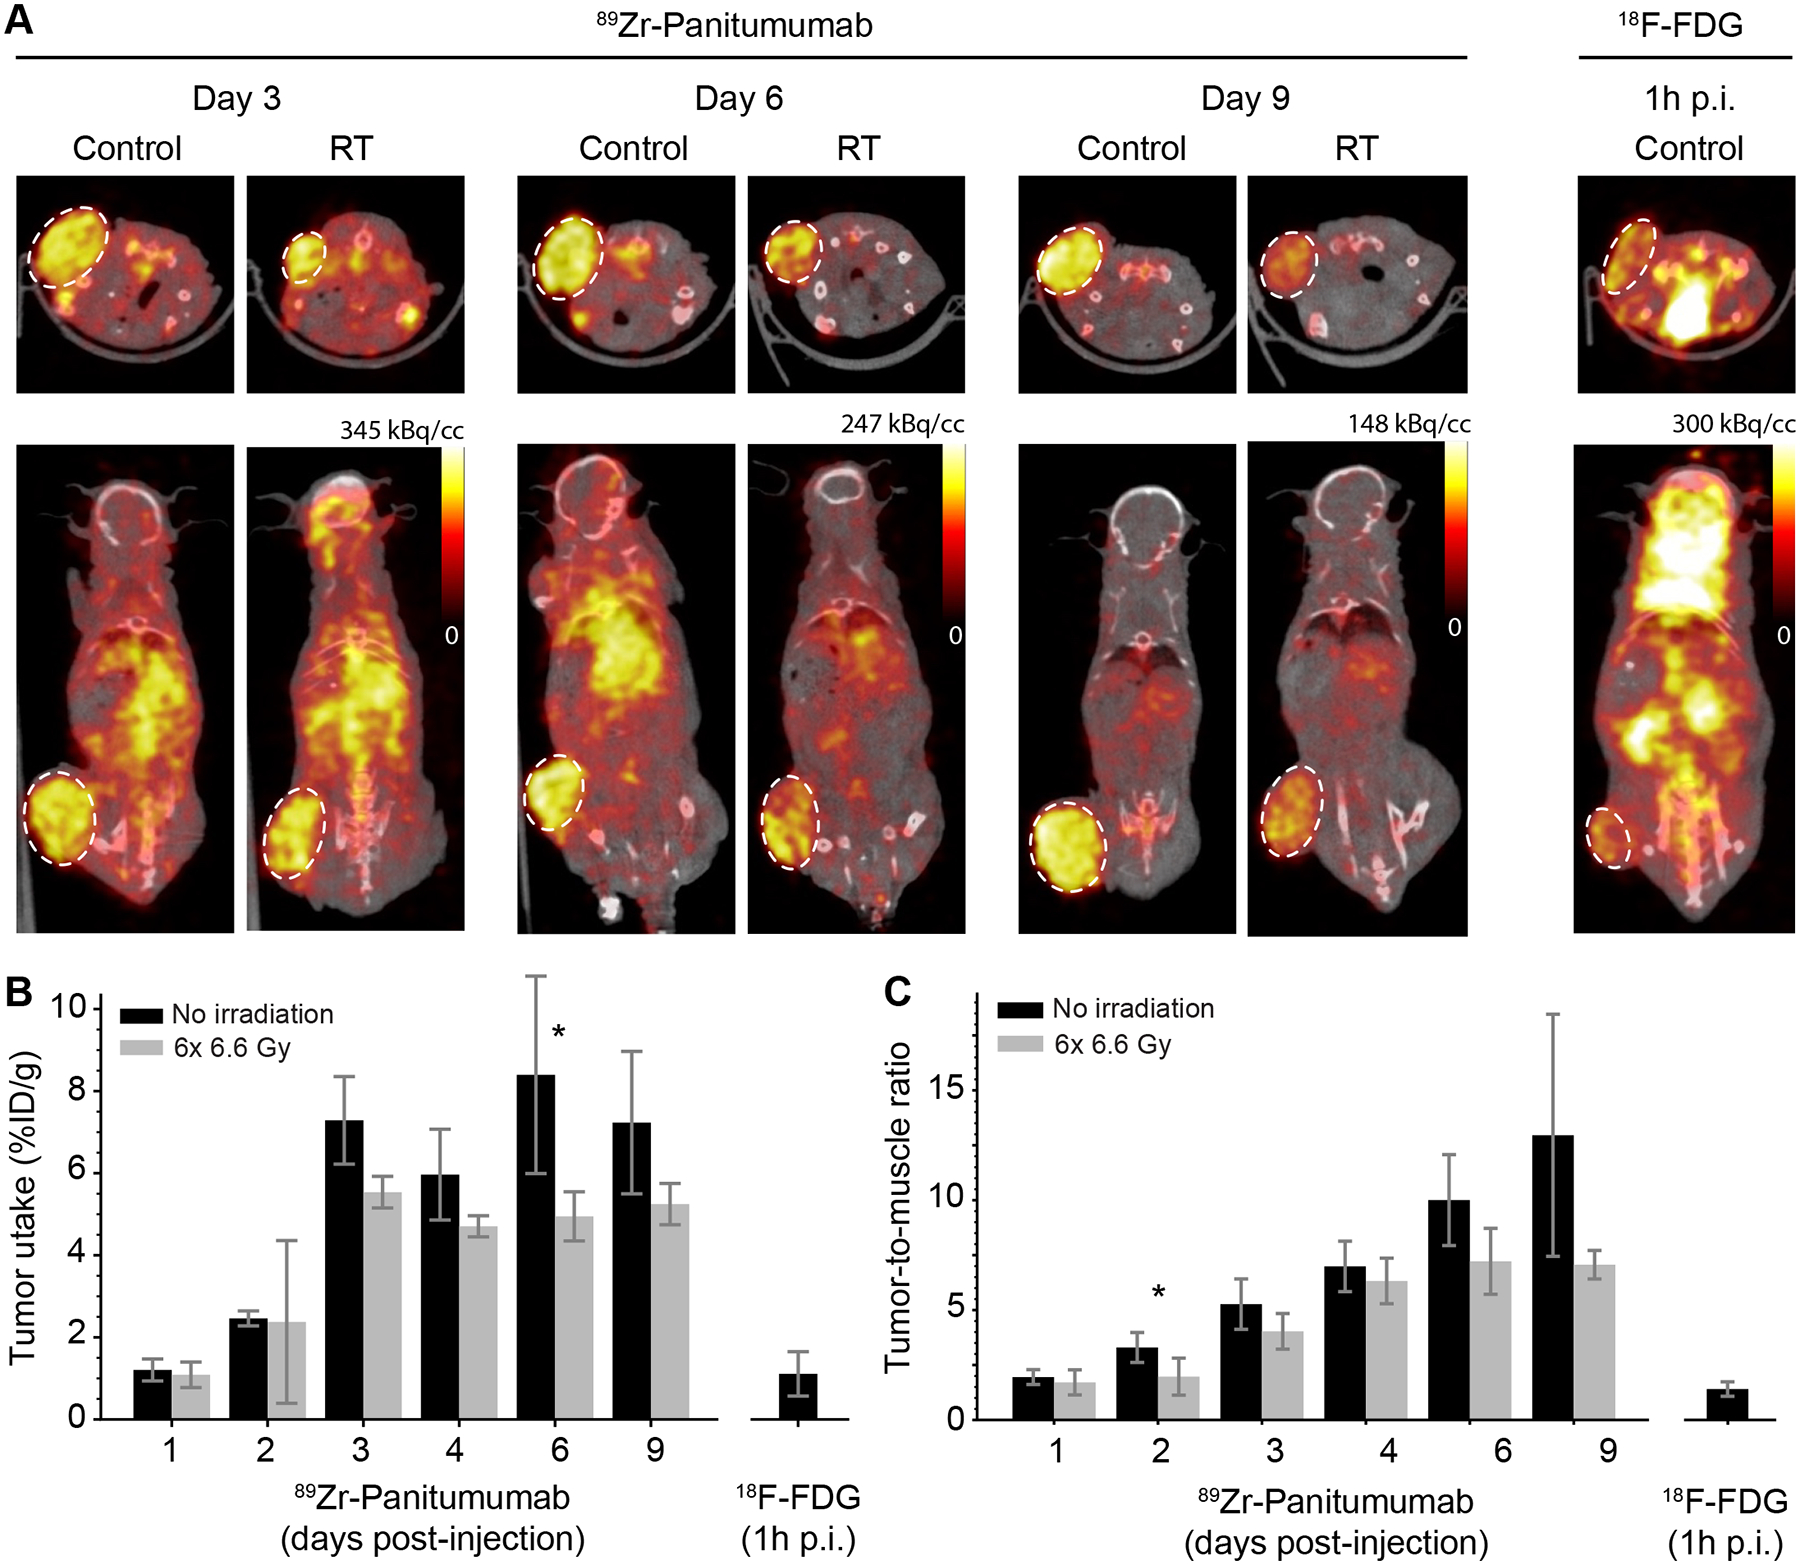
Figure 3.

PET imaging of 89Zr-Pan. (A) Representative PET/CT images acquired on Day 3, 6 and 9 post-injection, showing untreated mice (control; n=5) and mice receiving 6×6.6 Gy radiation (RT; n=5). Representative FDG uptake is shown in the same tumor model (n=4), demonstrating lower contrast than 89Zr-Pan. (B) Quantification of tumor uptake, expressed in terms of the percentage (%) of injected tracer dose per g of tissue, as a function of time. Although there is a consistent trend towards lower uptake in irradiated tumors, the difference between treated and untreated tumors meets the significance threshold only on Day 6 (* P = 0.01). (C) Quantification of tumor uptake, expressed as the ratio of tumor to muscle. Significance is only achieved on Day 2 (* P = 0.03). The differential uptake of 89Zr-Pan in tumor vs muscle increases over time due to the specificity of antibody binding.
