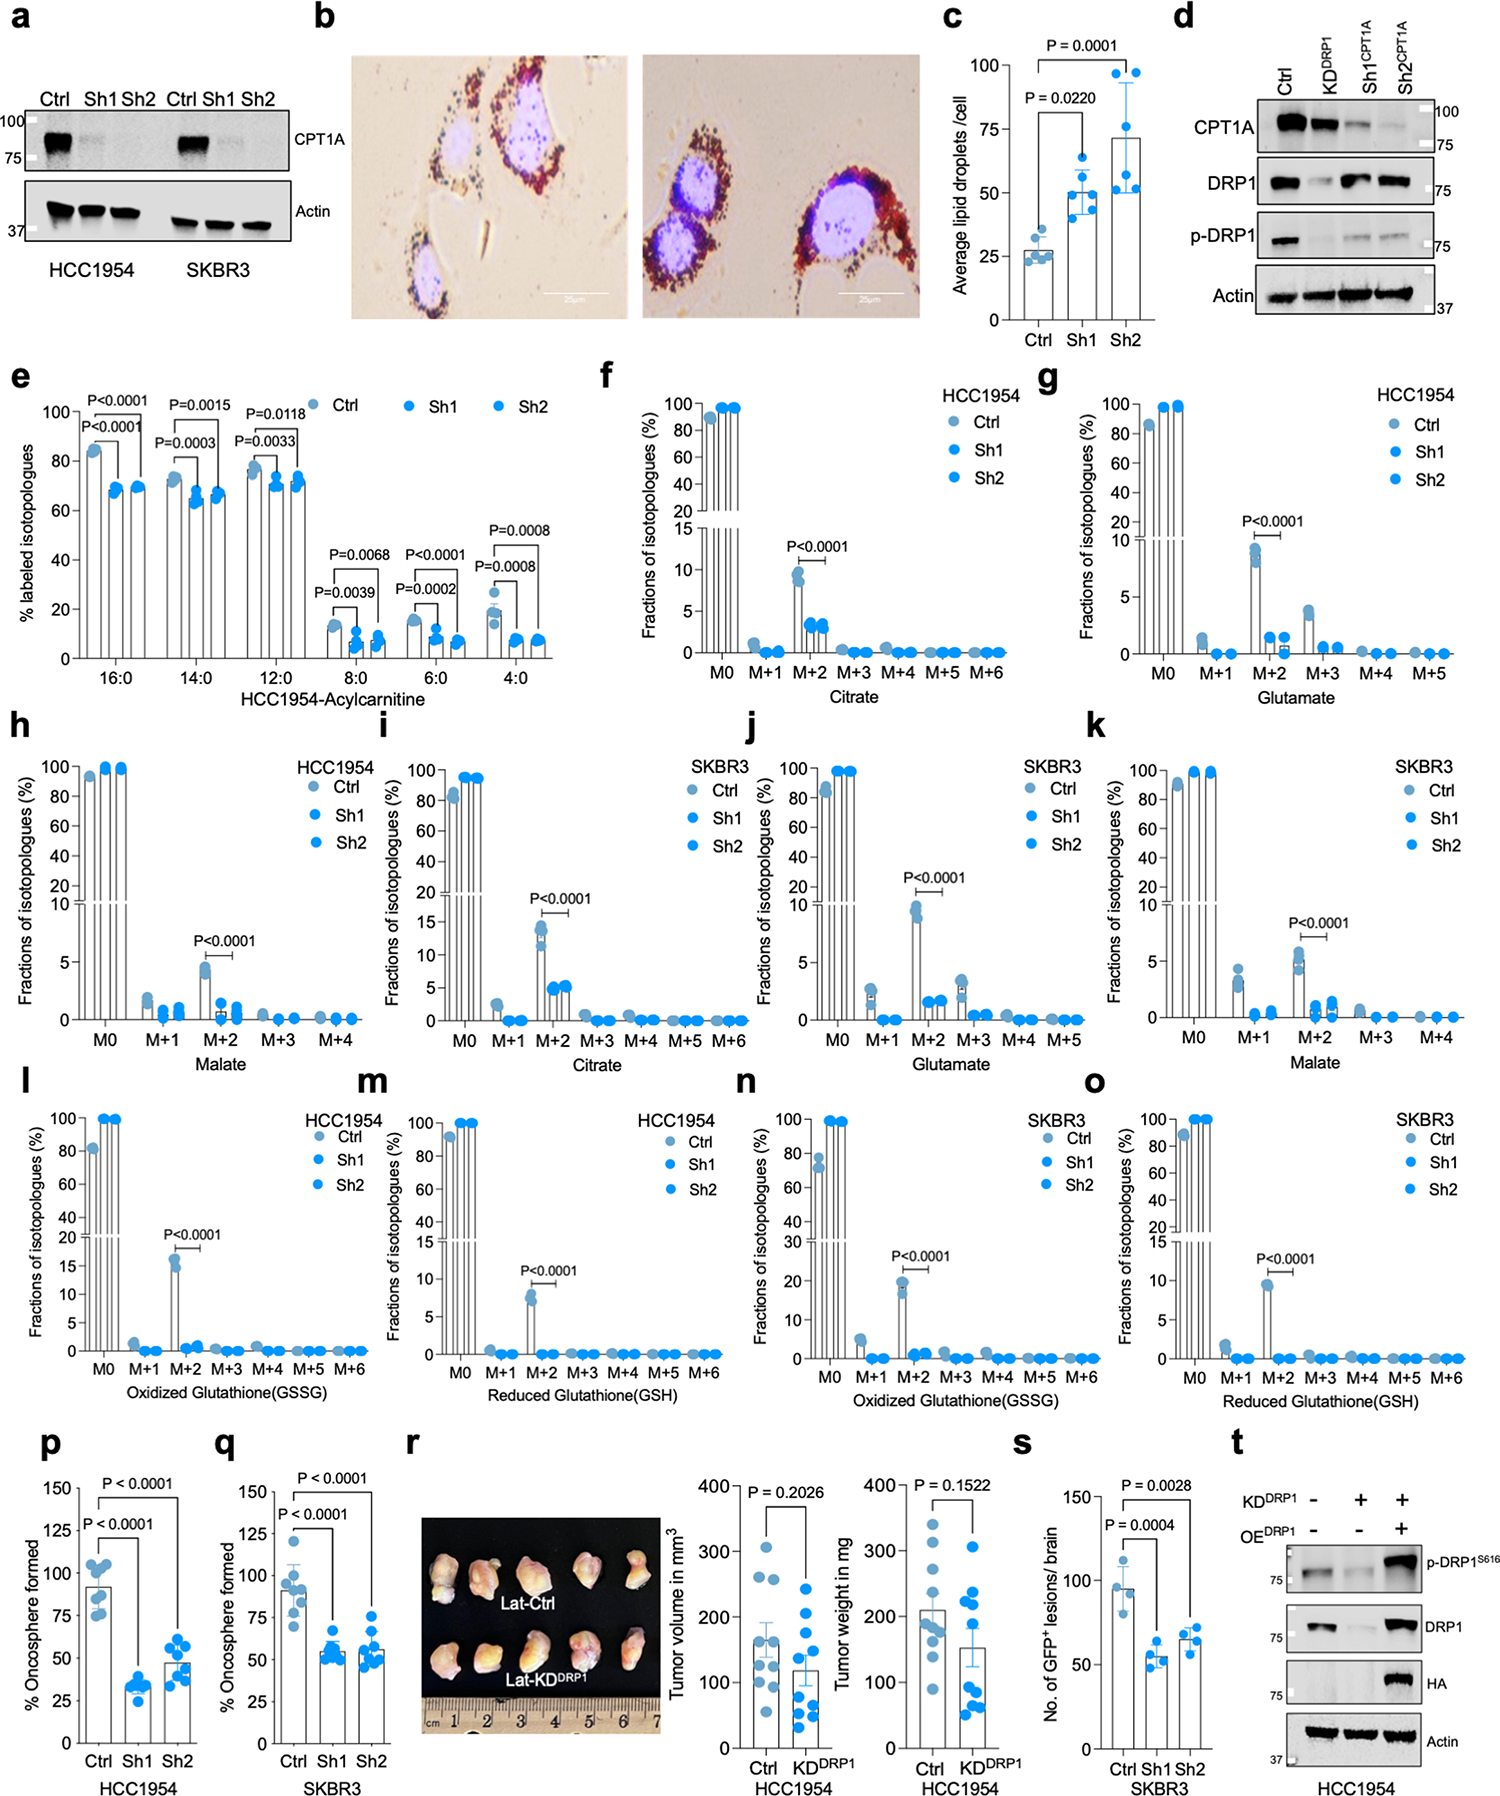
Extended Data Fig. 6 |. CPT1A aids FAO and altered mitochondrial dynamics in Latent cells.

a. Western blots showing validation of CPT1A knockdown in HCC1954 and SKBR3 Lat cells. b. Oil red O staining images showing differential accumulation of LDs in Ctrl and CPT1A-depleted Lat cells. c. Quantification of LDs in Ctrl and CPT1A knockdown Lat cells treated with sodium palmitate (100 μM) for 24 hours, n = 6, each group. d. Western blot images showing CPT1A, DRP1 and p-DRP1S616 in CPT1A and DRP1-depleted HCC1954 Lat cells. e. 13C16-Palmitic acid tracing showing enrichment of carnitine-conjugated fatty acids in Ctrl and CPT1A-depleted (Sh1, Sh2) HCC1954 Lat cells. f-k. LC-MS data showing labeling of citrate, glutamate, and malate isotopologues from 13C16-Palmitic acid in Ctrl and CPT1A-depleted HCC1954 and SKBR3 Lat cells. (Palmitate tracing in DRP1 and CTP1A depleted cells were performed using same controls). l-o. Showing fractions of GSH and GSSG isotopologues labeled from 13C16-palmitate in Ctrl and CPT1A-depleted HCC1954 and SKBR3 Lat cells. e-o. n = 4, each group. p and q. Showing the ability of oncosphere formation in Ctrl and CPT1A-depleted HCC1954 and SKBR3 Lat cells (n = 8) respectively. r. Orthotopic tumor generated from Ctrl (n = 10) and DRP1-depleted (n = 10) Lat cells. Tumors were collected 4 weeks post injection; tumor volume and weight were measured. s. Quantification of GFP + brain metastatic lesions in SKBR3 Lat cells (Ctrl and CPT1A-depleted knockdown; n = 4, each group). t. Western blot data showing rescue of DRP1 with doxycycline inducible overexpression of HA-tagged full-length DRP1 in DRP1-depleted cells Lat cells. In c, and e-q, ‘n’ represents biologically independent samples. r and s ‘n’ represent number of tumor and number of mice respectively. c, and e-s, data presented as mean + /−SEM. P values in c, e-q and s were calculated by Ordinary one-way ANOVA and r, two-tailed Unpaired t-test was used. The experiments shown in a, b, d, and t were repeated independently at least two or three times with similar results.
