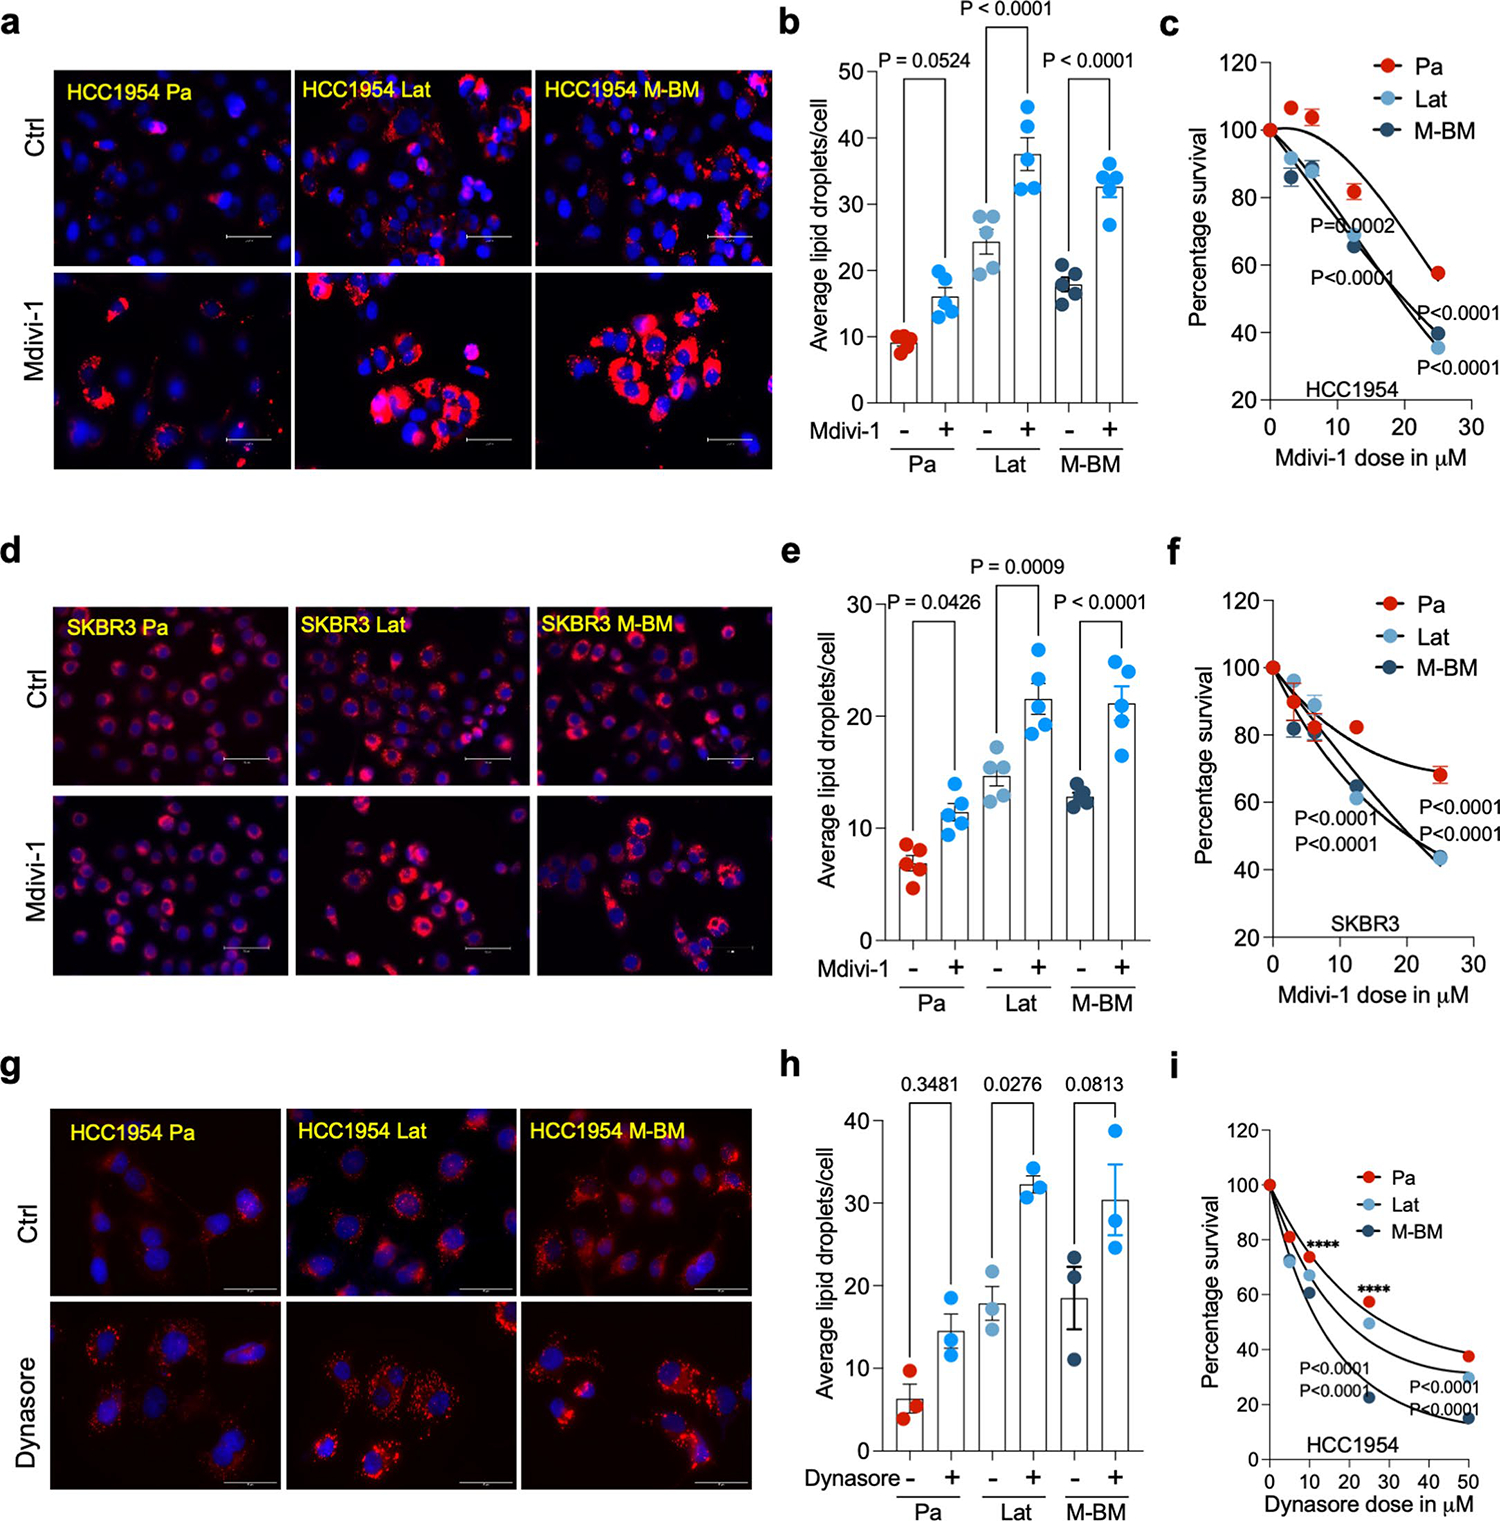
Extended Data Fig. 9 |. DRP1 inhibitors increases LDs and decreases survival of Latent and M-BM cells.

a. IF images of HCC1954 Pa, Lat, and M-BM cells with or without Mdivi-1 treatment (12.5 μM, 48 hours). b. Quantification of number of LDs between Ctrl and Mdivi-1 treated HCC1954 Pa, Lat, and M-BM (n = 5, each group) cells. c. Showing viability of HCC1954 Pa, Lat, and M-BM (n = 8, each group) cells upon Mdivi-1 treatment (0, 3.125, 6.25,12.5 and 25 μM) for 48 hours. d. IF images of SKBR3 Pa, Lat, and M-BM cells with or without Mdivi-1 treatment (12.5 μM, 48 hours). e. Quantification of number of LDs in SKBR3 Pa, Lat, and M-BM (n = 5, each group) cells after Mdivi-1 treatment. f. Showing viability of HCC1954 Pa, Lat, and M-BM (n = 8, each group) cells upon Mdivi-1 treatment (0, 3.125, 6.25,12.5 and 25 μM) for 48 hours. g. IF images of Ctrl and Dynasore treated HCC1954 Pa, Lat, and M-BM cells. h. Quantification of number of LDs in Ctrl and Dynasore treated (25 μM) HCC1954 Pa, Lat, and M-BM (n = 3, each group) cells. i. Showing viability of HCC1954 Pa, Lat, and M-BM (n = 8, each group) cells upon treatment of Dynasore (0, 5, 10,25 and 50 μM) for 48 hours. In b, c, e, f, h and i, ‘n’ represents biologically independent samples and data presented as mean + /−SEM and P values were calculated by Ordinary one-way ANOVA. The experiments shown in a, d, and g were repeated independently two times with similar results.
