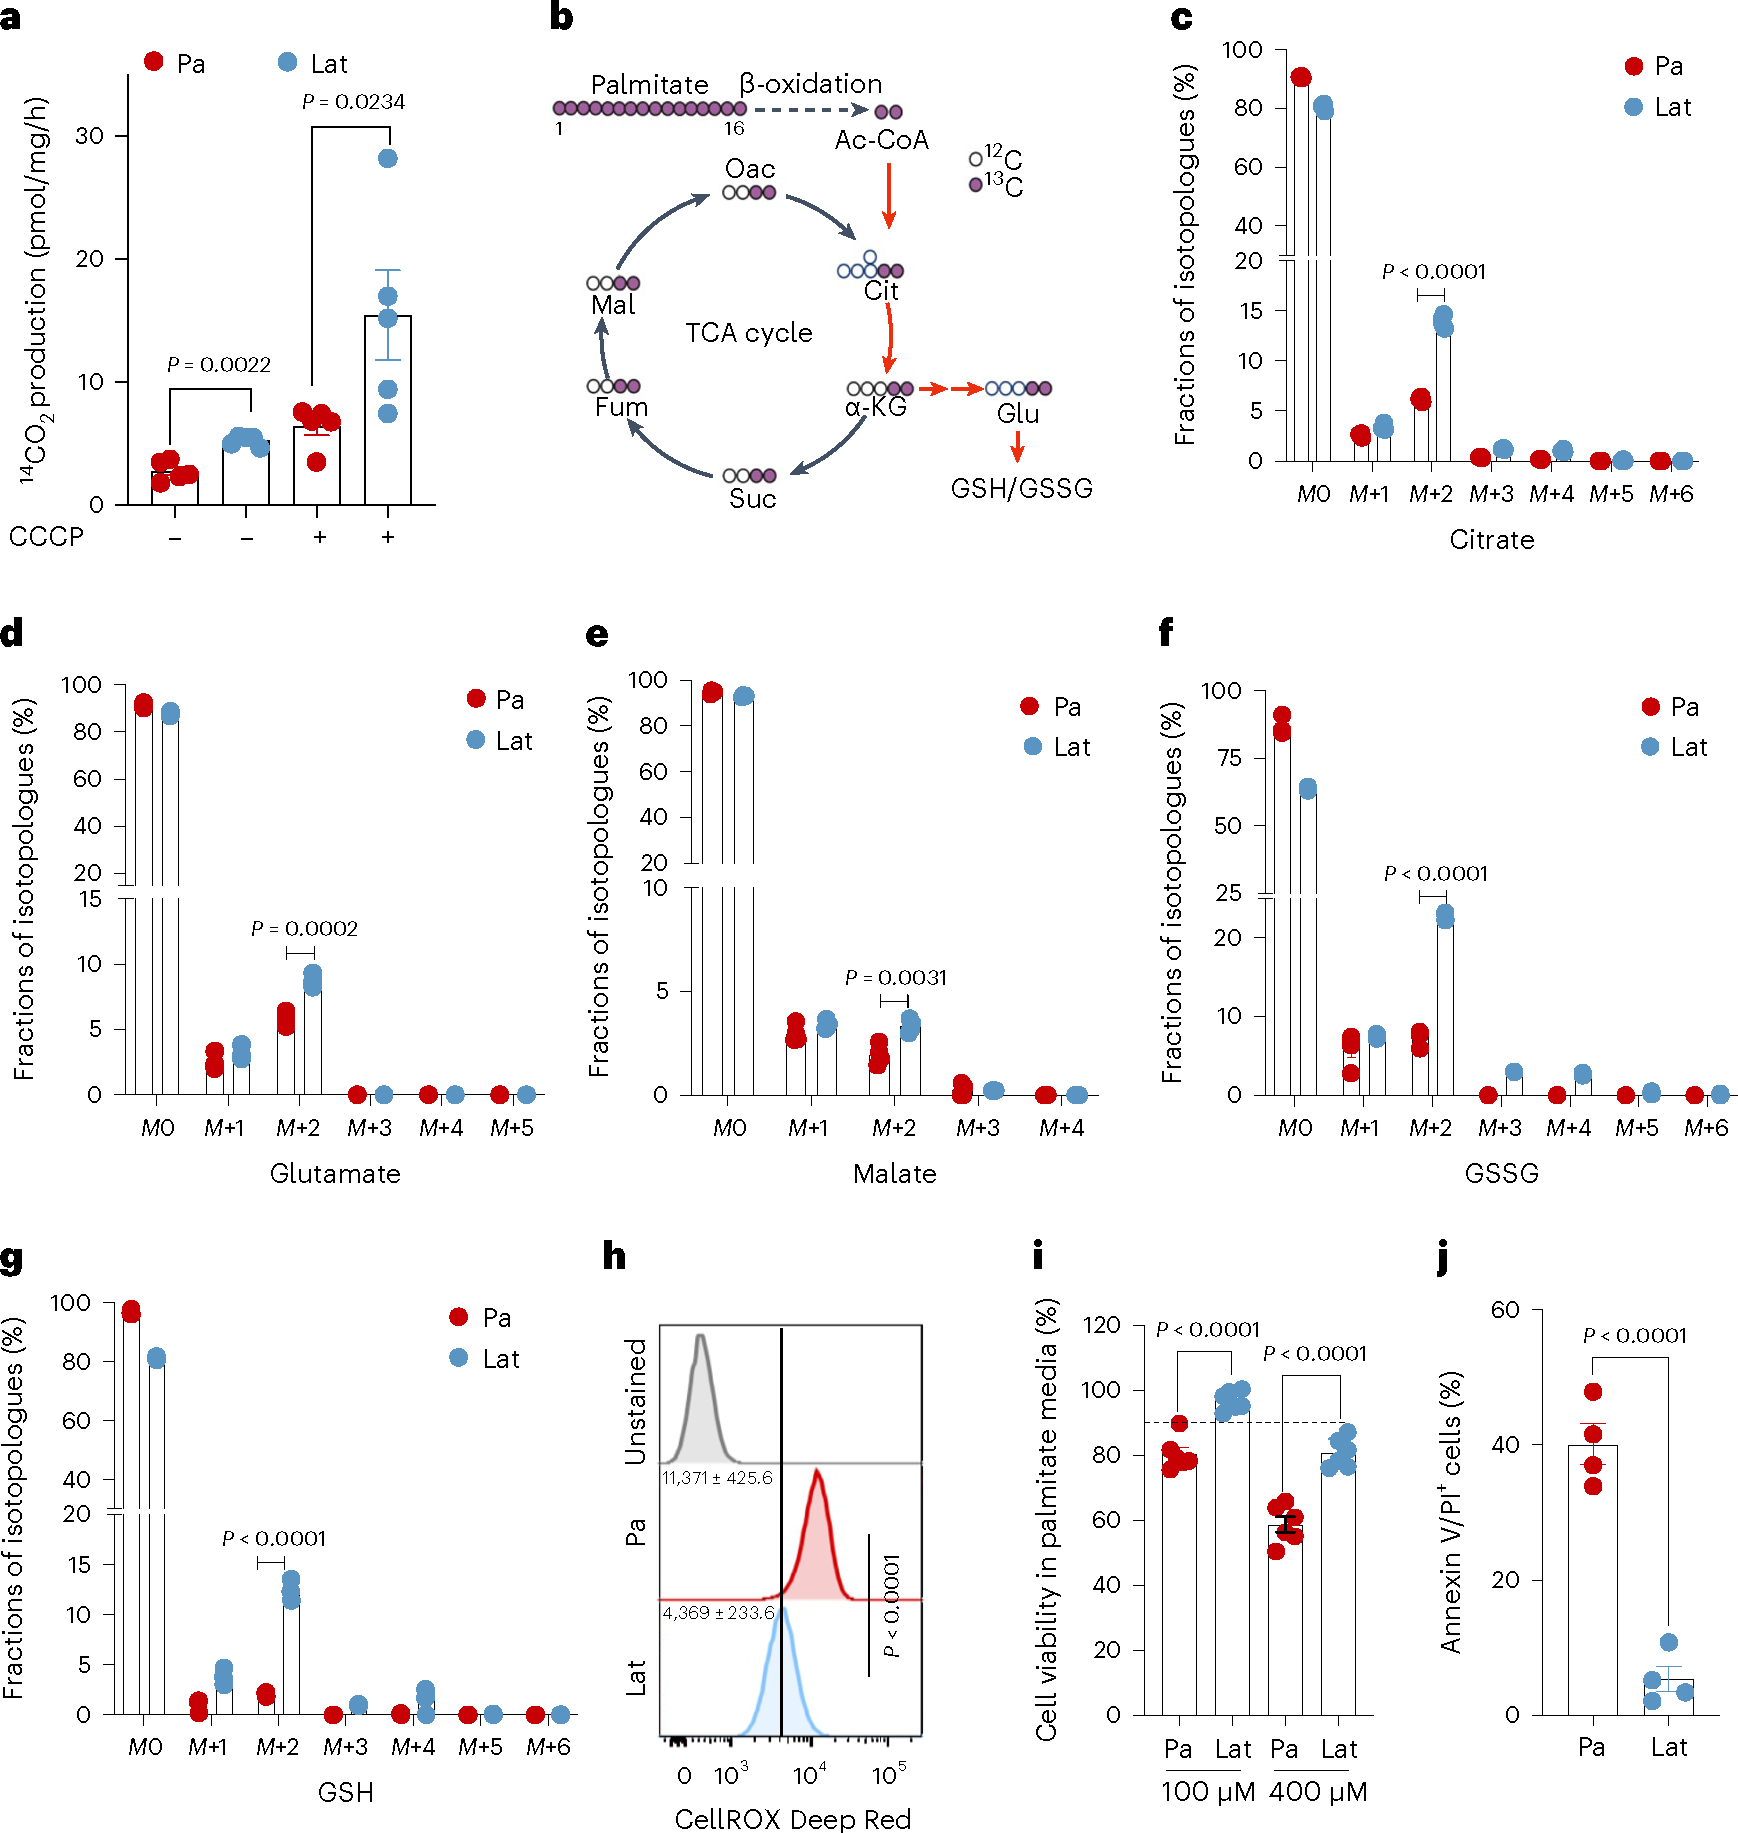
Fig. 2 |. Lat cells oxidize internalized FAs and maintain redox homeostasis.

a, Bar graph showing oxidation of 14C-palmitic acid (1μCi ml−1 and production of 14CO2 in presence of palmitic acid (100 μM), L-carnitine (1 mM) and glucose (10 mM) in Pa and Lat cells. n = 5, each group. b, Schematic illustration showing distribution of palmitate-derived carbon in TCA cycle intermediates and glutathione. Empty circles represent 12C and violet circles represent 13C (illustration was made using BioRender.com). c–g, 13C16 palmitic acid tracing showing enrichment of isotopologues of citrate (c), glutamate (d) and malate (e), GSSG (f) and GSH (g) in HCC1954 Pa and Lat cells, respectively. Briefly, cells were grown in R3F for 24 h and then treated with bovine serum albumin (BSA)-conjugated 13C16 palmitic acid (100 μM) for 24 h. Samples were collected in 80% methanol in water, and enrichment of metabolites was analyzed by LC–MS. n = 4, each group. h, Flow cytometry analysis of cellular ROS (CellROX Deep Red staining) in Pa and Lat cells (n = 8, each group). i, MTT cell viability assay showing survival of HCC1954 Pa and Lat cells (n = 6, each group) grown in palmitic acid (100 μM and 400 μM) for 48 h. j, Showing APC Annexin V/propidium iodide (PI)+ cells in HCC1954 Pa and Lat cells (n = 4, each group) treated with palmitic acid for 48 h. In a and c–j, ‘n’ represents biologically independent samples. Data are presented in a and c–j, as mean ± s.e.m., and P values in a and c–j were calculated by two-tailed unpaired t-test.
