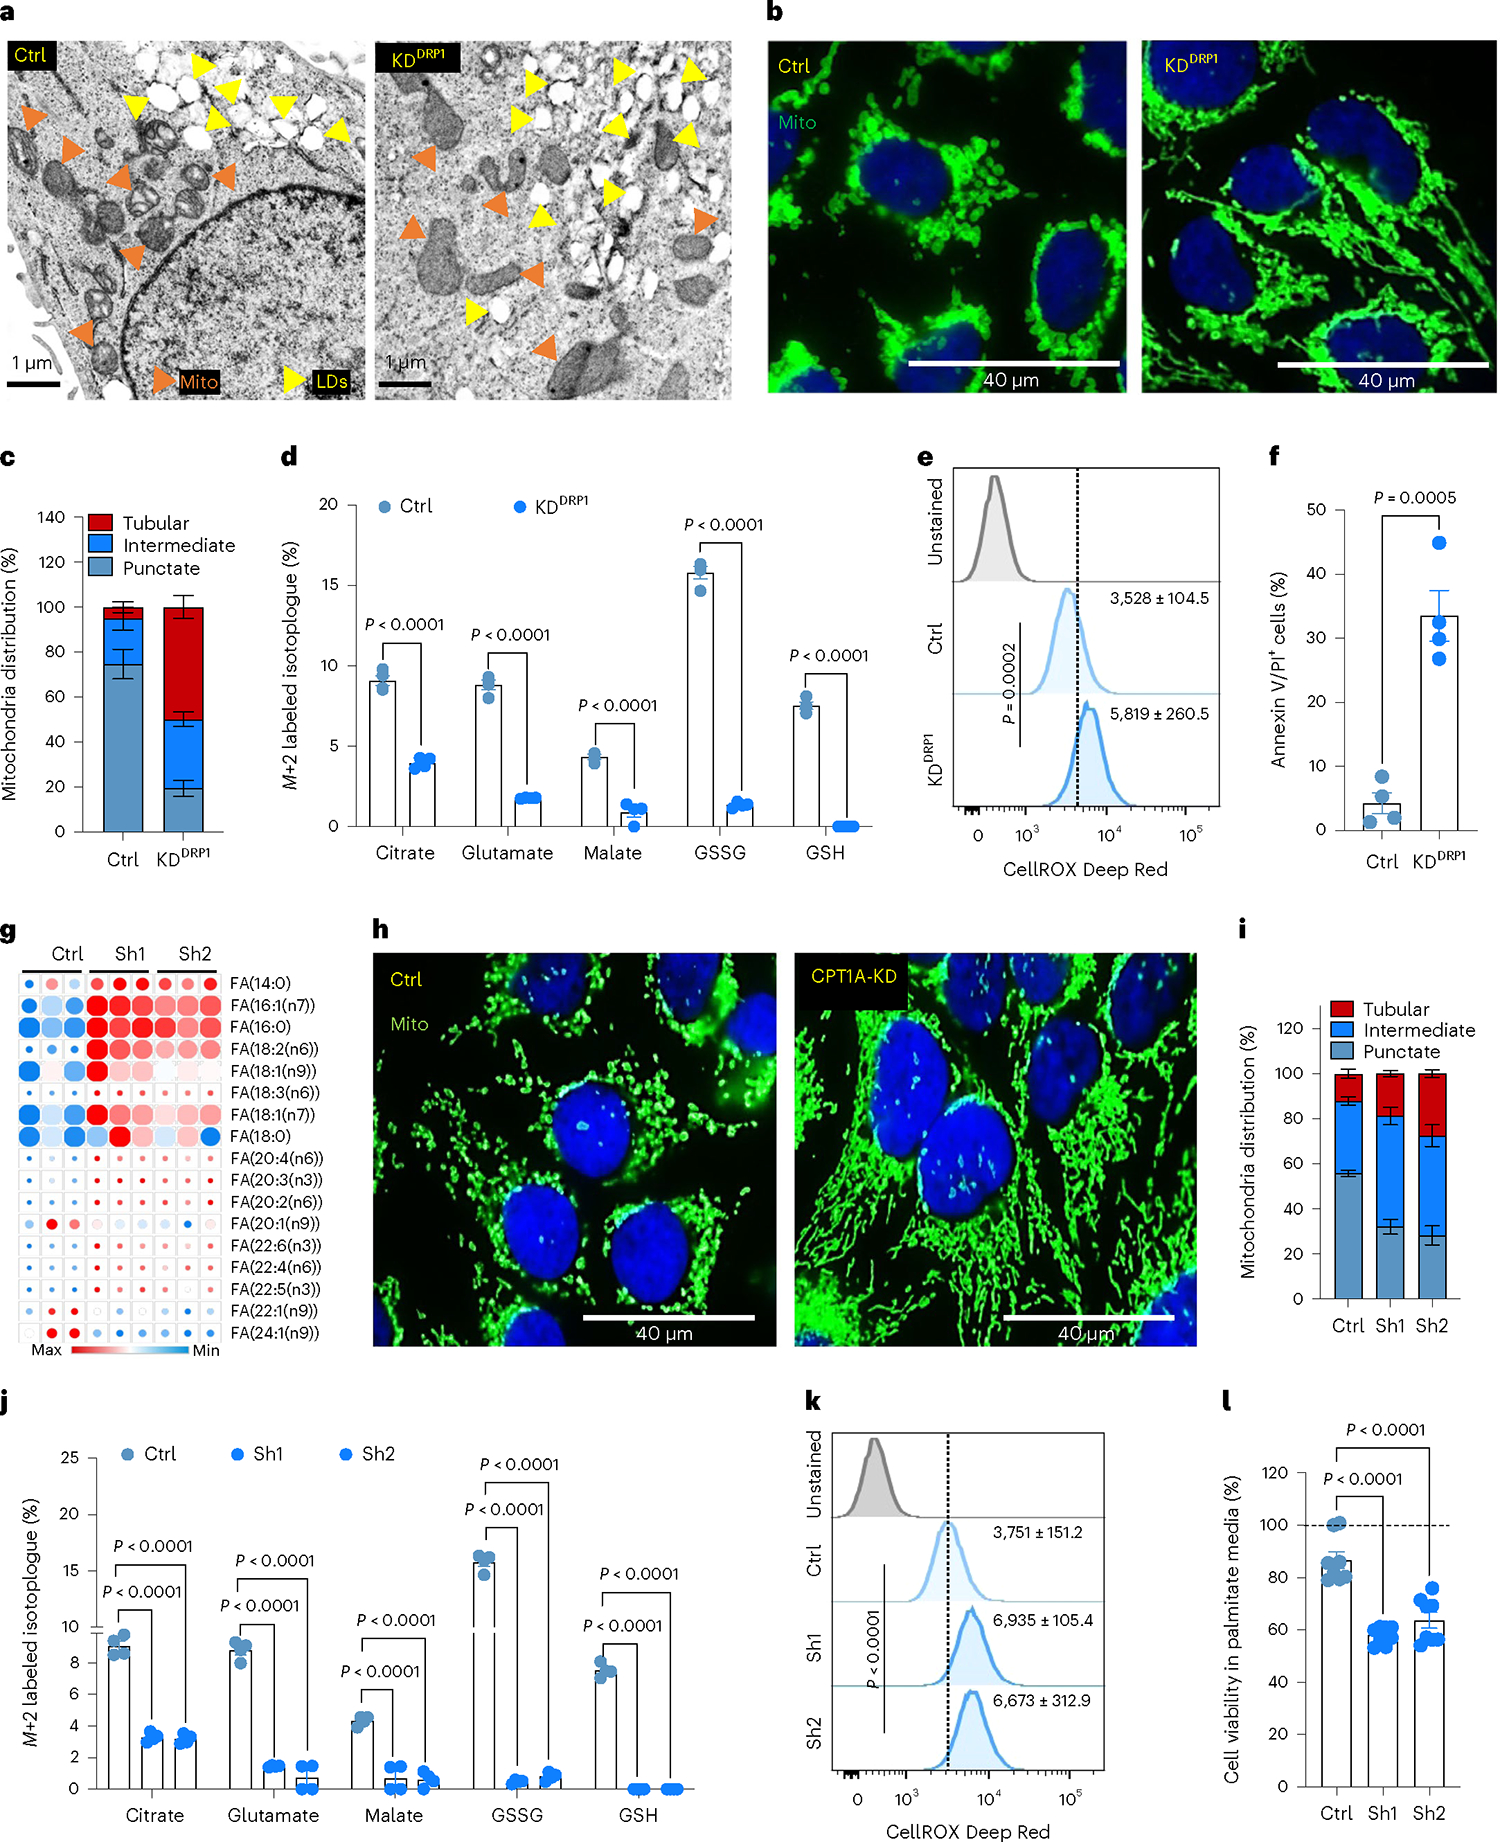
Fig. 3 |. DRP1-driven mitochondrial dynamics enable FAO and redox homeostasis.

a, TEM images showing LD and mitochondria in Ctrl and DRP1-depleted HCC1954 Lat cells. b, IF images highlighting altered mitochondrial dynamics in Ctrl and DRP1-KD Lat cells. c, Classification of cells based on percentage distribution of tubular, intermediate and punctate mitochondrial morphology in Ctrl (n = 5) and DRP1-KD (n = 4) HCC1954 Lat cells. d, LC–MS data showing enrichment of M+2 isotopologue of citrate, glutamate, malate, GSSG and GSH from 13C16-palmitic acid in Ctrl and DRP1-KD HCC1954 Lat cells. n = 4, each group. e, Flow cytometry analysis of cellular ROS (CellROX Deep Red staining) in Ctrl and DRP1-depleted Lat cells (n = 4, each group). f. Flow cytometry analysis showing APC Annexin V/PI+ cells in HCC1954 Ctrl and DRP1-depleted Lat cells (n = 4, each group) treated with 100 μM palmitic acid for 48 h. g, Heatmap of neutral lipids in Lat cells showing differential FA content upon CPT1A depletion in HCC1954 Lat cells (n = 3). Morpheus, Broad Institute software was used for generating heatmap. h, IF images showing mitochondrial morphology in Ctrl and CPT1A knockdown HCC1954 Lat cells. i, Quantification of mitochondrial morphology (percentage distribution of tubular, intermediate and punctate mitochondria) in Ctrl and CPT1A-depleted Lat cells, n = 5, each group. j, Labeling of M+2 isotopologue of citrate, glutamate, malate, GSSG and GSH from 13C16-palmitate in Ctrl and CPT1A-depleted HCC1954 Lat cells (13C16-palmitate tracing in DRP1 and CPT1A-depleted cells was performed in a single experimental set up with same control). n = 4, each group. k, CellROX Deep Red staining showing ROS in Ctrl and CPT1A-depleted HCC1954 Lat cells, n = 4, each group. l, MTT cell viability assay showing survival of Ctrl and CPT1A-depleted HCC954 Lat cells grown in palmitic acid (100 μM) for 48 h. n = 8, each group. In c–g and i–l, ‘n’ represents biologically independent samples, and data are presented as mean ± s.e.m. P values were calculated by two-tailed unpaired t-test (d–f) or ordinary one-way ANOVA (j–l). The experiments shown in a, b and h were repeated independently at least two or three times with similar results.
