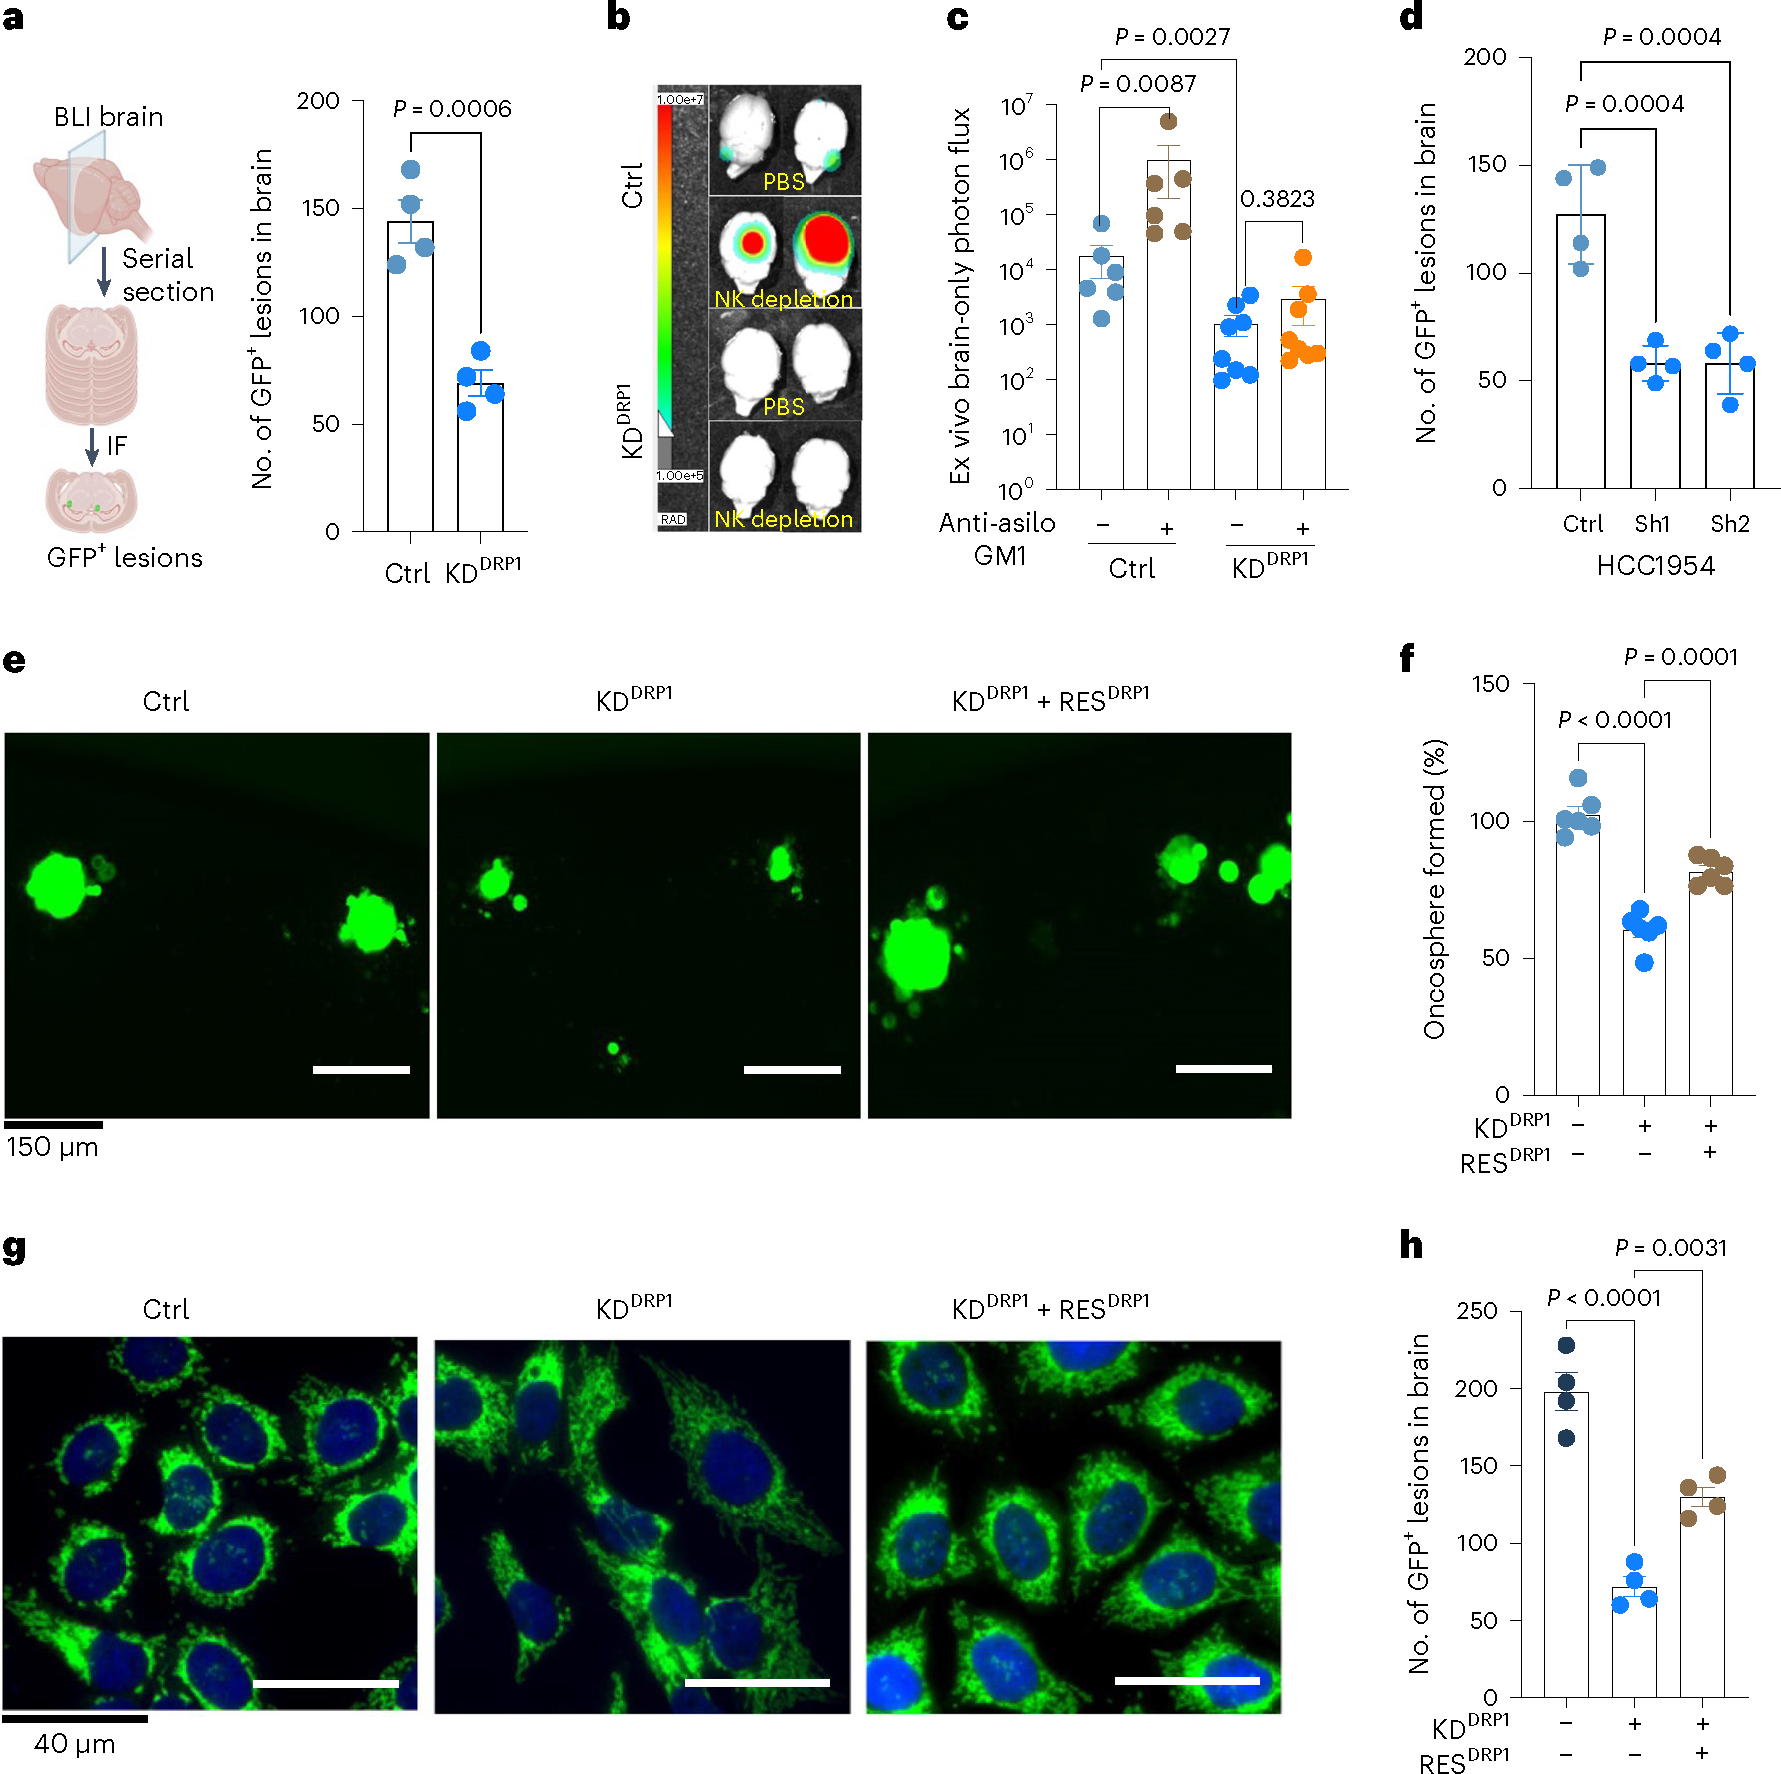
Fig. 4 |. DRP1-driven mitochondrial plasticity promotes metastatic latency.

a, Brain serial section and quantification of GFP+ brain tropic latent metastatic cells/lesions in Ctrl and DRP1-depleted HCC1954 Lat cells, n = 4, each group. Illustration was made using BioRender.com. BLI, bioluminescence imaging. b,c, Ex vivo brain images and bioluminescence signal showing brain-only photon flux in Ctrl (n = 6), Ctrl+ anti-asialo-GM1(n = 6), KDDRP1 (n = 8), and KDDRP1 + anti asialo-GM1 (n = 8). Here, mice were injected with Ctrl and DRP1-depleted Lat cells, followed by vehicle or anti asialo-GM1 treatment. d, Brain serial section and quantification of GFP+ brain tropic latent metastatic cells/lesions in Ctrl and CPT1A knockdown HCC1954 Lat cells, n = 4, each group. e,f, Showing oncosphere image and quantification in Ctrl, DRP1-depleted and DRP1-rescued HCC1954 Lat cells. n = 6, each group. g, IF images showing mitochondrial morphology in Ctrl, DRP1-depleted and DRP1-rescued HCC1954 Lat cells. h, Brain serial section and quantification of GFP+ brain tropic latent metastatic cells/lesions in HCC1954 Ctrl, DRP1-depleted and DRP1-rescued Lat cells, n = 4, each group. In a, c, d, and h, ‘n’ represents the number of mice, and in f represents biologically independent samples, with data presented as mean ± s.e.m. P values were calculated by two-tailed unpaired t-test (a), two-tailed Mann–Whitney U-test (c) or ordinary one-way ANOVA (d, f, h). The experiment shown in g was repeated independently two times with similar results.
