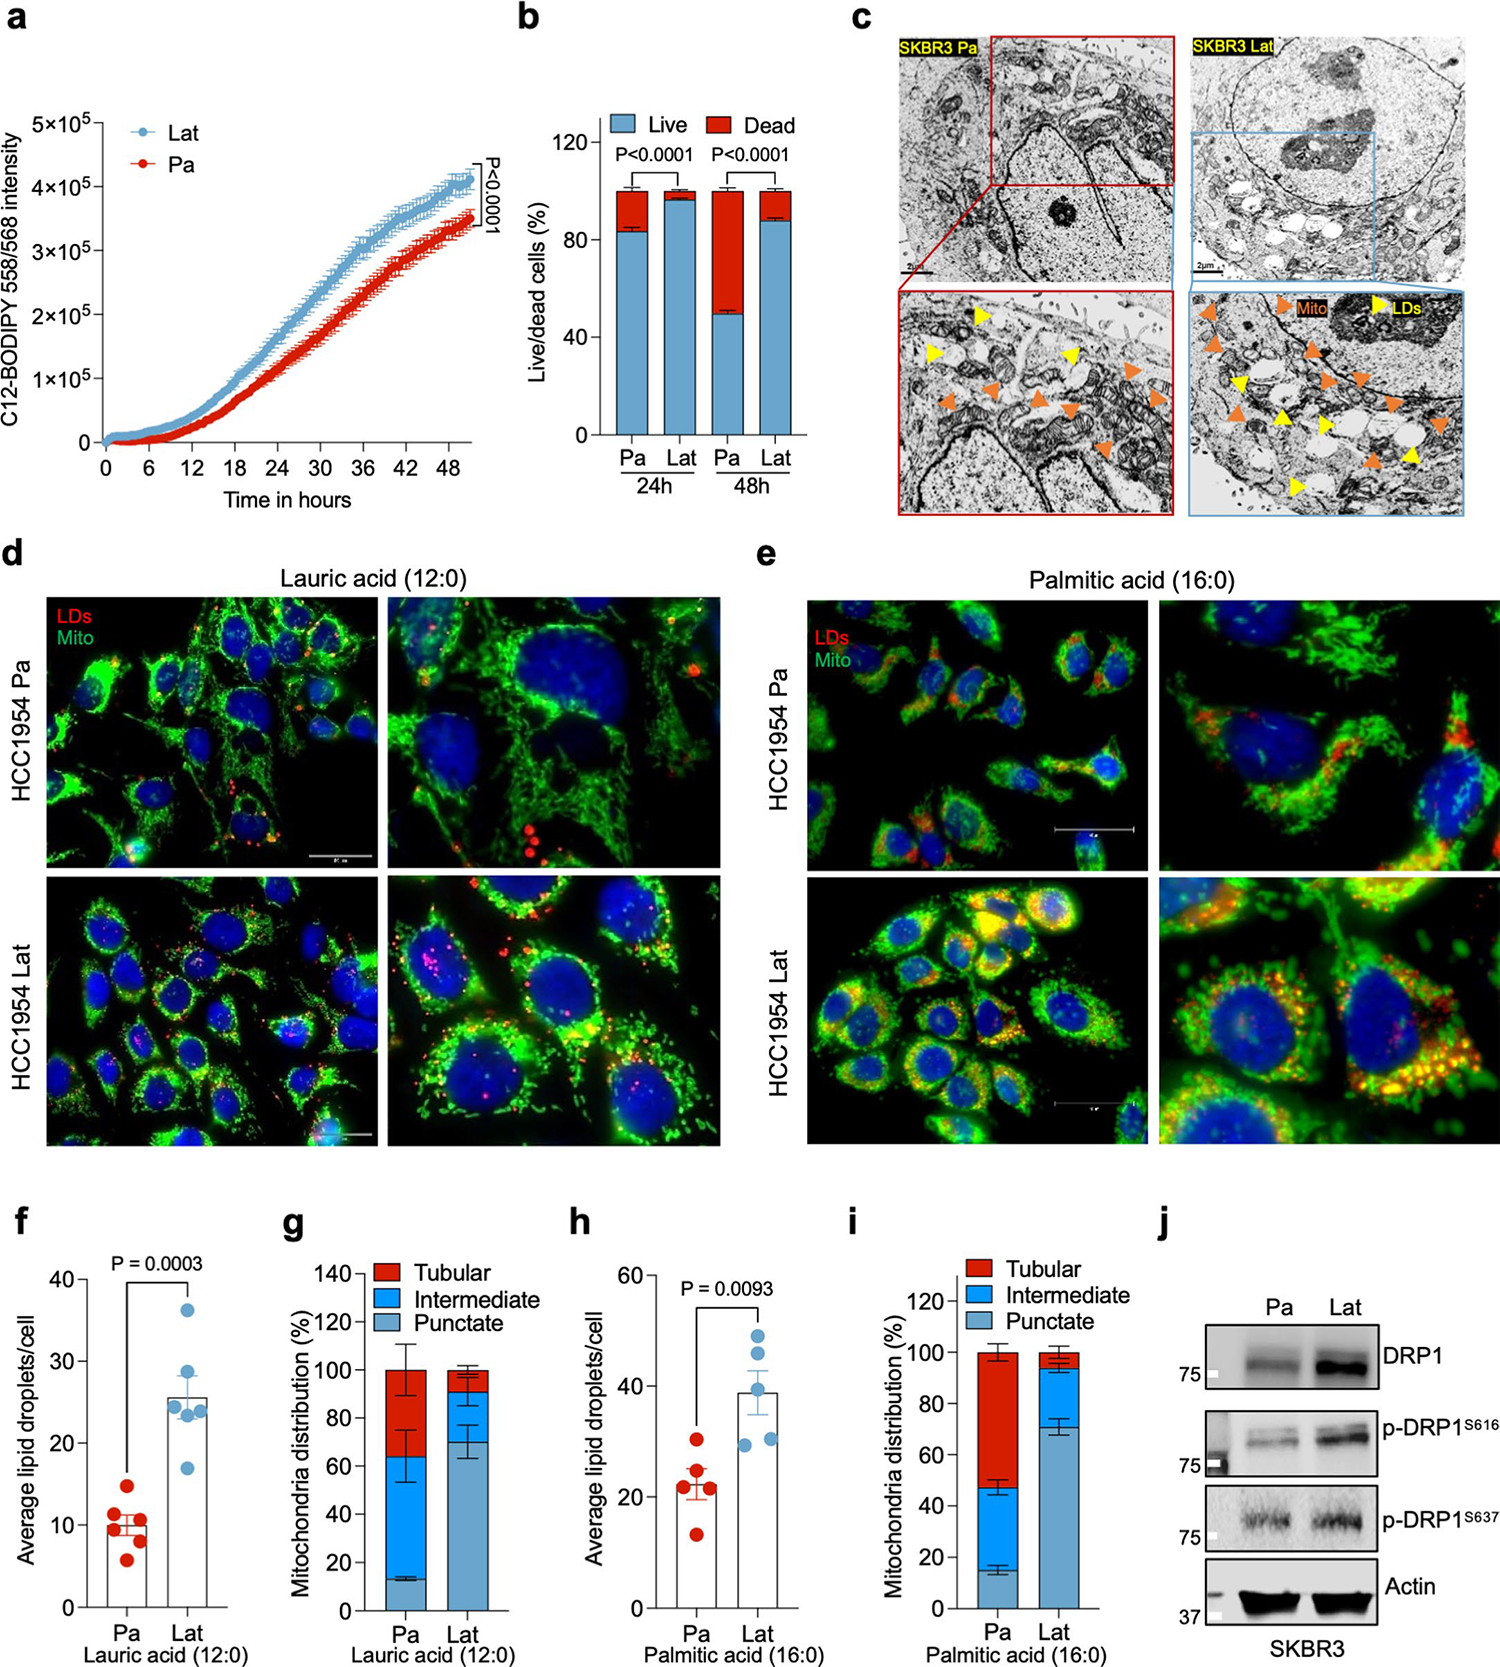
Extended Data Fig. 2 |. Fragmented mitochondria puncta and LDs enriched in Latent cells.

a. IncuCyte3 data showing time dependent lipid uptake in HCC1954 Pa and Lat cells in BODIPY-558/568-C12 treated condition. Data were exported as Mean and SEM from n = 25 different fields. P value was calculated by two-tailed Paired t-test. b. Bar graph showing survival of HCC1954 Pa and Lat cells cultured with BODIPY-558/568-C12. Percentage live/dead cells were quantified at 24 and 48 hours, n = 6, each group. c. Transmission electron microscope (TEM) images showing LDs and mitochondria in SKBR3 Pa and Lat cells. SKBR3 Pa and Lat cells were cultured in MatTek dishes for 24 hours with R3F media followed by treatment of sodium palmitate(100 μM) for 24 hours before processed for TEM. d and e. IF images of HCC1954 Pa and Lat cells showing LDs (red) and mitochondria (green). Briefly, cells were treated with 100 μM lauric acid or palmitic acid for 24 hours. Cells were fixed and stained with Nile red followed by anti-TOMM20 antibody labeling was performed to visualize LDs and mitochondria respectively. f. Bar graph showing LDs, in HCC1954 Pa and Lat cells after lauric acid treatment, n = 6, each group. g. Percentage distribution of tubular, intermediate and punctate mitochondrial morphology in HCC1954 Pa and Lat cells treated with lauric acid (n = 4, each group). h. Quantification of LDs in palmitate treated HCC1954 Pa and Lat cells. n = 5, each group. i. Classification of cells based on percentage distribution of tubular, intermediate and punctate mitochondrial morphology in palmitate treated HCC1954 Pa (n = 5) and Lat (n = 6) cells. j. Western blot images showing expression of DRP1 along with p-DRP1S616and p-DRP1S637 in SKBR3 Pa and Lat cells respectively. In b and f-i, ‘n’ represents biologically independent samples and data presented as mean + /−SEM. P value in b, f, and h were calculated by two-tailed Unpaired t-test. The experiments shown in c, d, e, and j were repeated independently at least two or three times with similar results.
