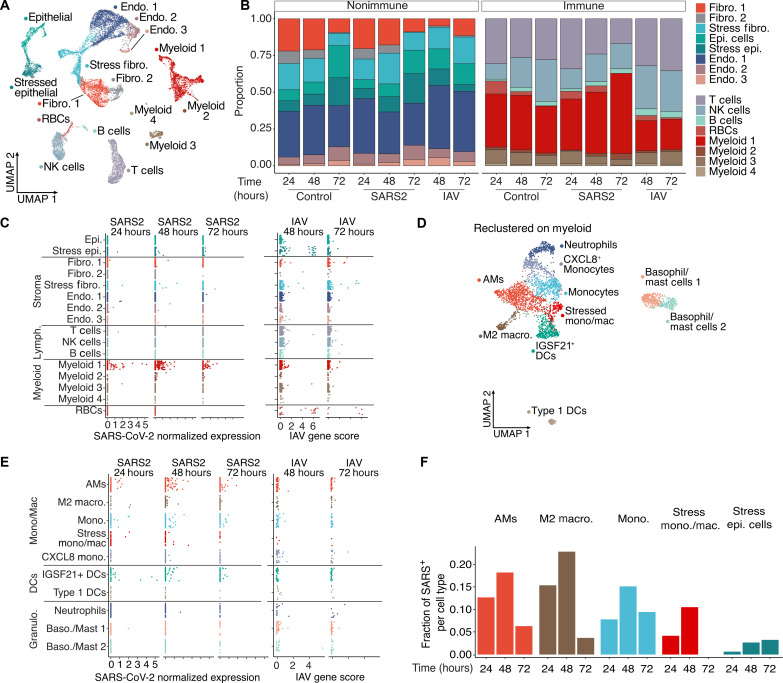
Fig. 2. SARS-CoV-2 displays tropism for myeloid cells compared to IAV.
(A) A Uniform Manifold Approximation and Projection (UMAP) visualization of cells from control, SARS-CoV-2, and IAV-infected PCLS (two donors, three technical replicates) collected at distinct times. (B) Relative quantification of cell types from the different experimental conditions, stratified by time point. (C) Scatterplots describing the library-normalized SARS-CoV-2 expression across various cell types in SARS-CoV-2–infected PCLS (left) or IAV gene score in IAV-infected PCLS (right). (D) A UMAP of finely annotated myeloid cell types in the dataset. (E) Distribution of infected myeloid cells similar to (C). (F) The fraction of SARS-CoV-2–positive cells at different time points.

