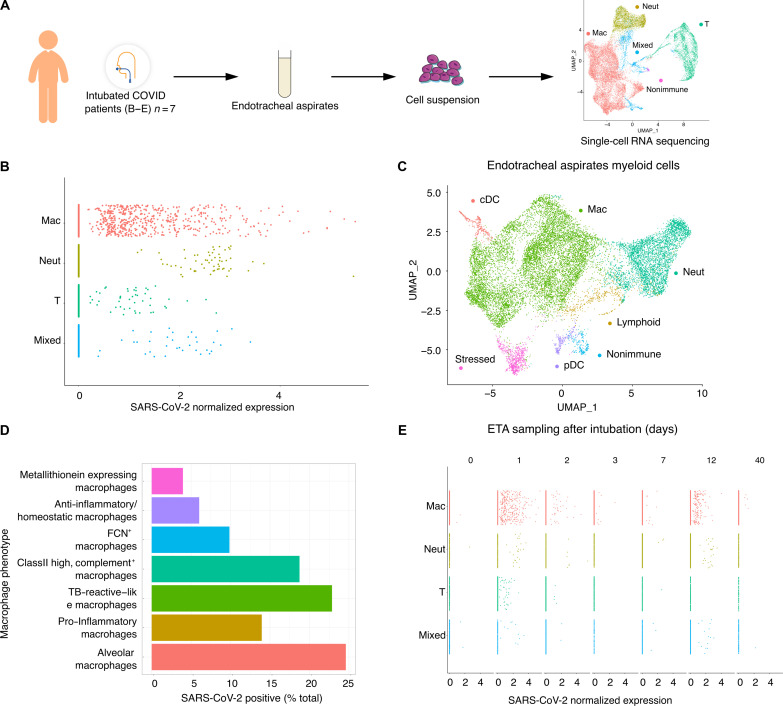
Fig. 3. Tropism of SARS-CoV-2 for myeloid cells in ETAs from COVID-19 individuals with ARDS.
(A) ETAs were collected from SARS-CoV-2 infected individuals with ARDS and tested with scRNA-seq. UMAP at far right shows landmark populations. (B) Distribution of per-cell normalized SARS-CoV-2 expression in landmark cell types. (C) UMAP projection of myeloid subtypes in ETAs. (D) Fraction of SARS-CoV-2–positive cells per myeloid cell type (E) Days (D0 to D40) at the top of the graph represent the days after intubation when the ETA samples were collected. Each column represents a unique COVID-19 individual except for postintubation day 2, where two individuals are represented. See table S2 for details.

