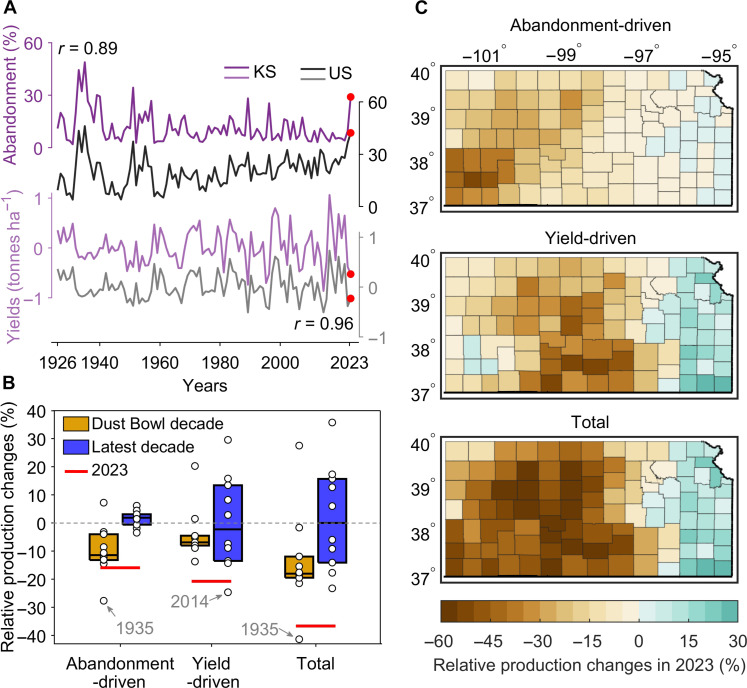
Fig. 2. Climate-driven changes in production attributed to crop abandonment and yields.
(A) Observed time series for both crop abandonment and yield anomalies for Kansas (KS) and the United States winter wheat belt (US) including Nebraska, Colorado, Kansas, Oklahoma, and Texas. (B) State-level relative climate-driven production changes due to changes in abandonment and yields during the Dust Bowl decade (1931 to 1940), latest decade (2013 to 2022), and year 2023. The relative production changes are expressed as production changes relative to average production during 1981 to 2010. The boxes delimit the 25th and 75th percentiles, and the horizontal black lines represent the 50th percentile. (C) County-level relative production changes due to changes in abandonment and yield in the year 2023.

