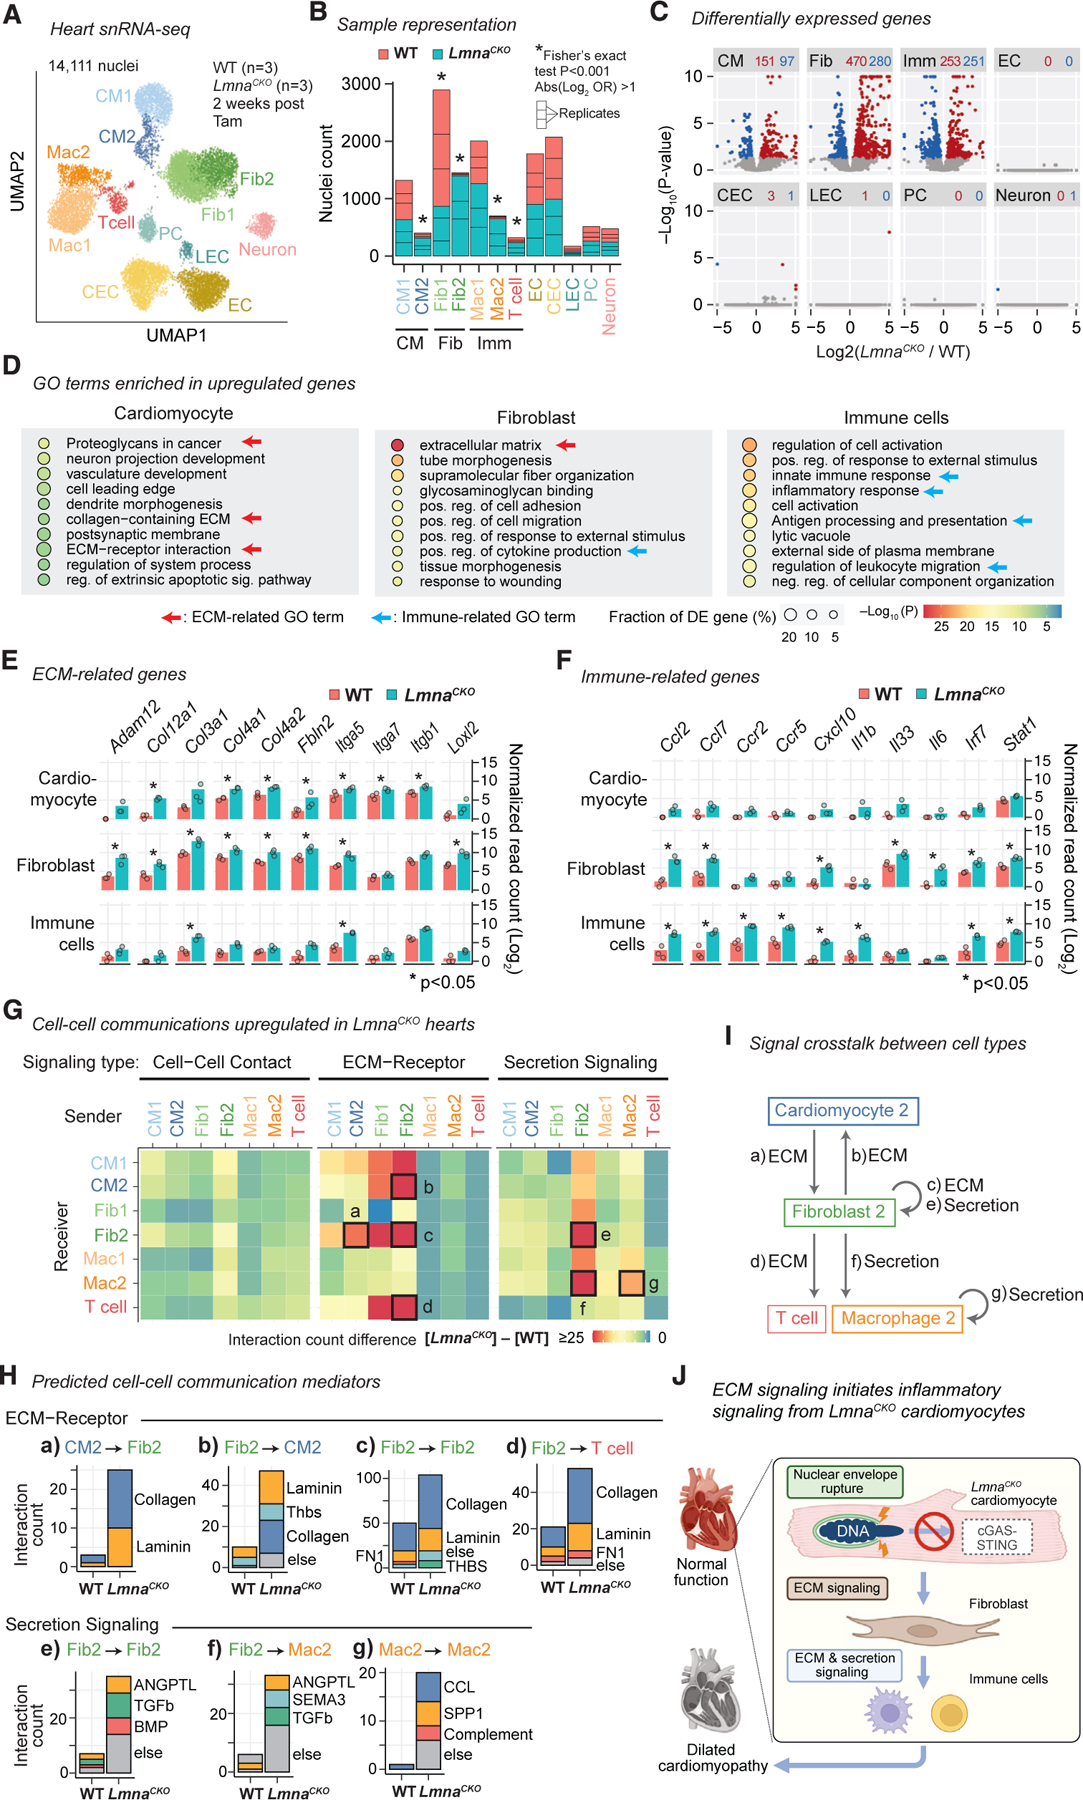
Figure 4. ECM-mediated signaling from LmnaCKO cardiomyocytes is predicted to activate fibroblasts.

(A) snRNA-seq uniform manifold approximation and projection (UMAP) plot for WT and LmnaCKO heart nuclei. CM, cardiomyocyte; Fib, fibroblast; Mac, macrophage; EC, endothelial cell; CEC, coronary EC; LEC, lymphatic EC; PC, pericyte. See Figure S4 for additional analyses.
(B) WT and LmnaCKO nucleus count within each cell type cluster. Cell types combined in later analyses are indicated below the graph.
(C) snRNA-seq pseudo-bulk volcano plot comparing LmnaCKO versus WT heart nuclei. Red, upregulated genes. Blue, downregulated genes. The number of differentially expressed genes is indicated above the plot.
(D) GO terms enriched among upregulated genes within indicated cell type. p value is computed by Metascape.54
(E) Pseudo-bulk transcript abundance of ECM-related genes. Point, mean of normalized read count per replicate. Bar, mean across replicates. P, FDR-adjusted p value computed by a generalized linear model in DESeq2.55
(F) Same as (E) but for immune-related genes.
(G) Predicted signaling from sender cells (x axis) to receiver cells (y axis). Color: signaling gains in LmnaCKO hearts relative to WT hearts.
(H) Predicted signaling mediators for the signaling indicated by box in (G) with alphabetical labels.
(I) Predicted intercellular signaling indicated in (G) by alphabetical labels in LmnaCKO hearts.
(J) Model.
