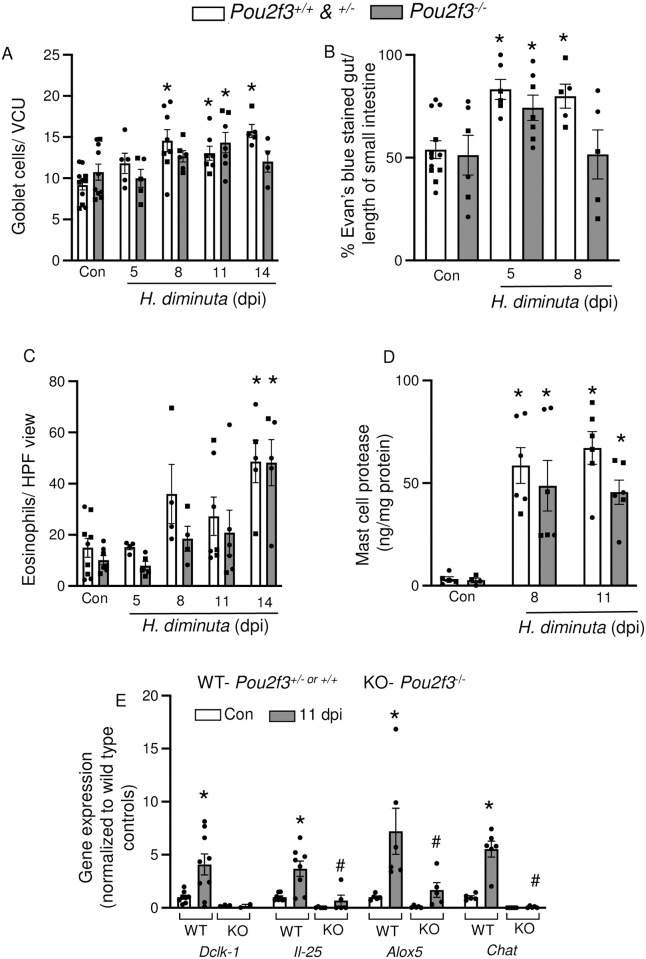
Fig 6. Tuft cell-deficient mice display local deficiencies in response against H. diminuta.
Male (●) and female (◼) littermate Pou2f3+/+, +/-, -/- mice were infected with 5 cysticercoids of H. diminuta and assessed at days post-infection (dpi). (A) Goblet cells (PAS+) were enumerated in mid-jejunal sections and are represented as number of cells/villus crypt unit (VCU) averaged over at least 3 full VCUs/mouse. (B) Small intestinal transit was measured as % of the small intestine covered by Evan’s blue dye 15 min after oral gavage. (C) Eosinophils were enumerated in mid-jejunal sections and presented as cells per HPF. (D) Mast cell protease-1 concentrations were measured by ELISA in mid-jejunal homogenates. (E) Small intestinal epithelial cell isolations from naïve mice and H. diminuta-infected mice (11 dpi) were used for mRNA analysis. Gene expression data were normalized within each sample to the housekeeping gene 18S rRNA and then to uninfected wild type mice. Data are mean ± SEM, n = 2-9/group, pooled from 2–3 experiments, (A-D) * represents p<0.05 compared to uninfected mice and (E) * and # represent p<0.05 analysed by two-way ANOVA and Tukey’s post-test, where * compared to uninfected mice of the respective genotype and # compared to infected wild type (WT) control.

