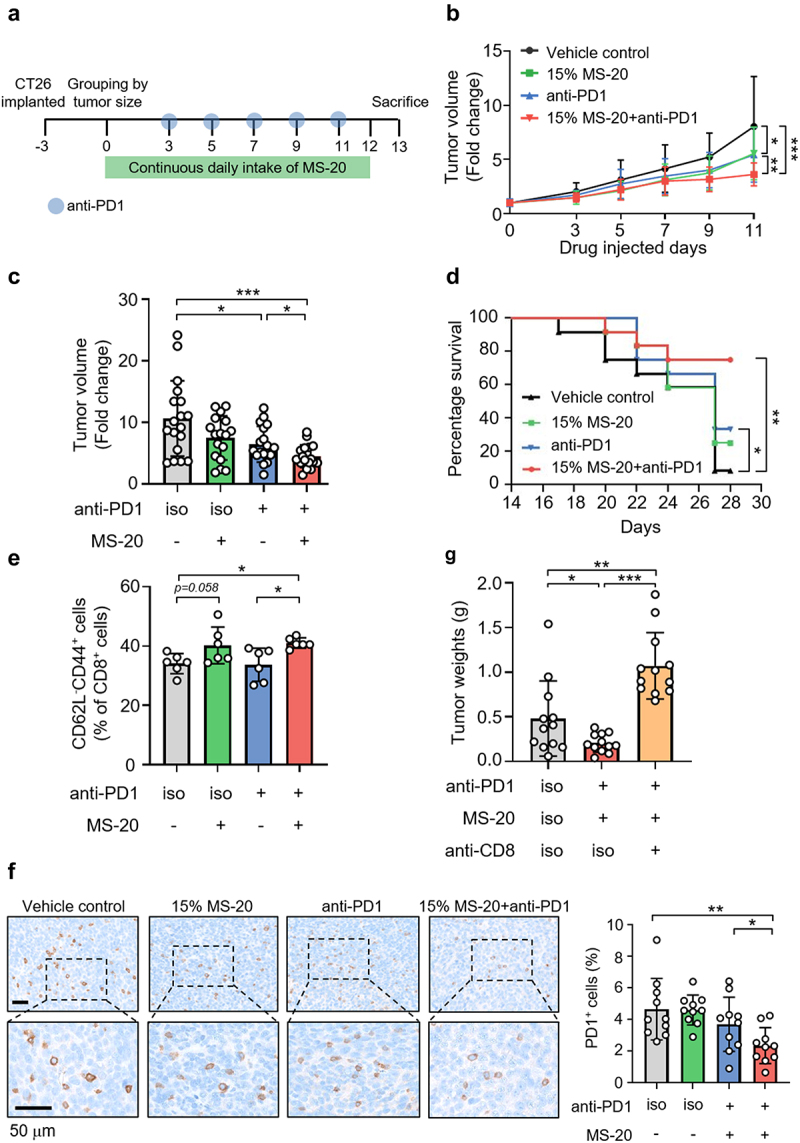
Figure 1.

MS-20 plus an anti-PD1 antibody inhibited colon cancer growth in vivo.
Note: CT26 cells (2 × 10⁵) were subcutaneously injected into BALB/c mice. After tumor growth, the mice were randomly assigned to the vehicle control, 15% MS-20, anti-PD1 or 15% MS-20 plus anti-PD1 groups (a). Tumor growth was recorded (n = 17-18/group). The tumor volume was normalized to that on day 0, and the data represent the combination of two independent replicates (b). The tumor volume on the day of sacrifice was normalized to that on day 0, and the data represent the combination of two independent replicates (n = 17-18/group) (c). The survival curves of the vehicle control, 15% MS-20, anti-PD1 and 15% MS-20 plus anti-PD1 groups were determined (n = 12 mice/group) (d). CD62L−CD44+CD8+ T cells were determined using flow cytometry (n = 6/group) (e). IHC staining revealed PD1+ signals in the vehicle control, 15% MS-20, anti-PD1 and 15% MS-20 plus anti-PD1 groups. The number of cells in whole tumor tissue was quantified using HALO software, and the percentage of PD1+ cells was calculated as the sum of PD1+ cells divided by the total number of nuclear cells (n = 10/group) (f). Tumor weights of the vehicle control, 15% MS-20 plus anti-PD1 antibody and 15% MS-20 plus anti-PD1 and anti-CD8 antibody groups. (n = 11-12/group) (g). The data represent the mean±sd (b, c, e, f, g). The differences were assessed using Student’s t test (b, c, e, f, g) or the log-rank test (d). *p ≤ 0.05, **p ≤ 0.01 and ***p ≤ 0.001.
