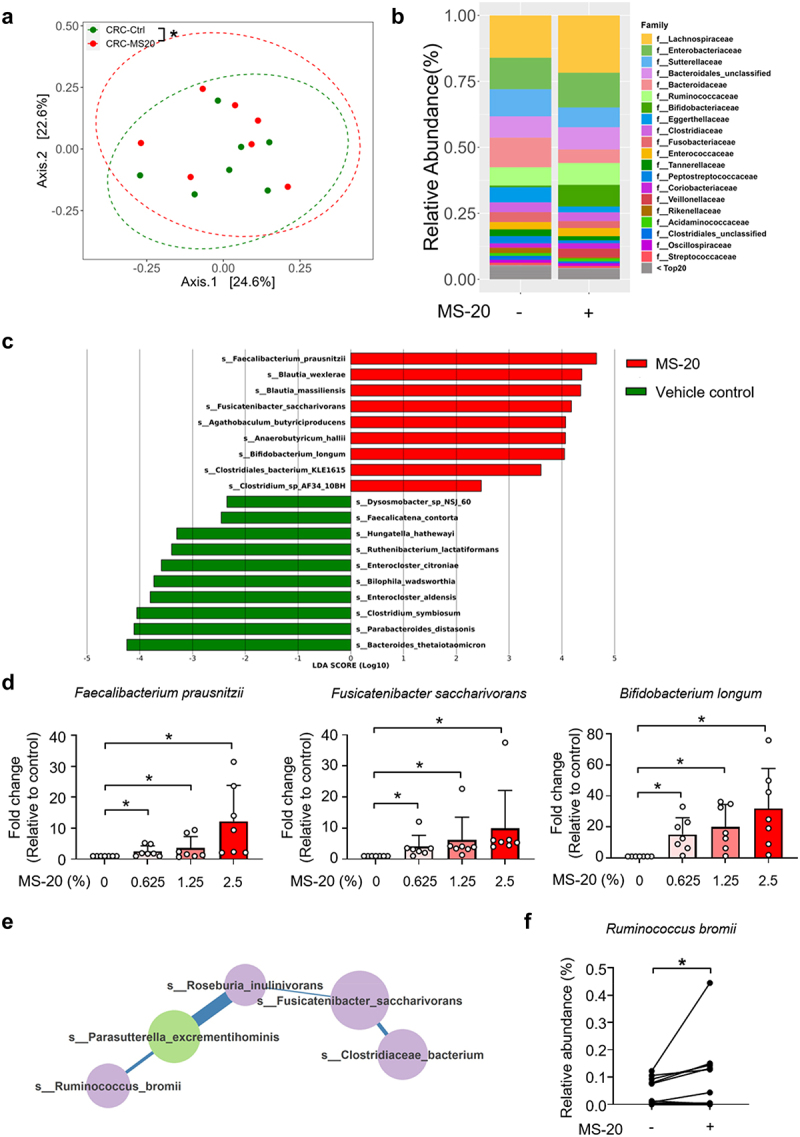
Figure 5A.

MS-20 regulated the microbiota of cancer patients ex vivo.
The feces of colon cancer patients were treated with the vehicle control or 2.5% MS-20 for 24 h, and the microbiota was analyzed via metagenomics analysis. β-diversity of the control and 2.5% MS-20 groups was assessed (a). The bacterial composition at the family level was determined in the control and 2.5% MS-20 groups (b). LEfSe was used to identify differentially abundant bacteria between the vehicle control and 2.5% MS-20 groups. Bacteria with LDA scores ≥ 2 are shown (c). The feces of colon cancer patients were treated with the indicated dose of MS-20 for 24 h, and immunotherapy response-associated bacteria were examined using RT-qPCR (n = 7/group) (d). The co-occurrence networks of the vehicle control and MS-20 treatment groups were analyzed, with a specific focus on the 0.5% prevalence threshold. The data revealed an R. bromii-dominant network following MS-20 treatment (e). The relative abundance of R. bromii in cancer patients after MS-20 treatment was determined (n = 15/group) (f). The MetaCyc analysis predicted metabolic pathways in fecal samples from individuals with CRC treated with or without MS-20. LEfSe was used to determine linear discriminant analysis (LDA) scores for differentially abundant pathways in the vehicle control versus MS-20 treatment groups. A heatmap was generated to show the abundance of each outcome-associated pathway in each sample; the largest value was defined as the maximum, and the smallest value was defined as the minimum (n = 7/group) (g). The relative abundance of significant metabolic pathways were determined. The relative abundance of metabolic pathways that were classified in the same category according to MetaCyc were added together and are shown for individual samples. Each dot represented an individual sample. (n = 7/group) (h-i). The data are presented as the mean±sd (d, f, h, i). The differences were assessed using permutation testing (a), the Wilcoxon rank sum test (d), the Wilcoxon signed rank test (f) or Student’s t test (h, i). *p ≤ 0.05, **p ≤ 0.01 and ***p ≤ 0.001.
