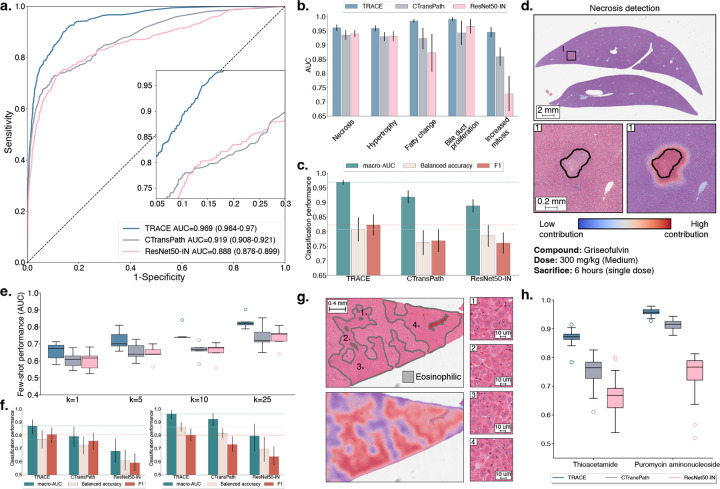
Figure 2: Weakly supervised slide classification.
a. Multi-label AUROC and macro-AUC comparisons of TRACE against ResNet50-IN and CTransPath encoders, with an AttnPatchMIL model for 5-class lesion classification. b. Class-wise AUC of AttnPatchMIL. c. Macro-AUC, balanced accuracy, and F1 comparisons of TRACE against other encoders. d. Visualization of necrosis attribution using AttnPatchMIL and 80% patch overlap. Blue represents low contribution, and red represents high contribution. e. Few-shot learning performance of TRACE against ResNet50-IN and CTransPath evaluated using linear probing. Slide embeddings are defined by taking the average patch embedding (MeanMIL), and are evaluated using macro-AUC for varying numbers of training samples k for each class. f. Single-slide prompting for detecting eosinophilic changes in thioacetamide (left) and basophilic changes in puromycin aminonucleoside (right). g. Visualization of the similarity between the slide prototype and each patch embedding of a high-dose sample with eosinophilic cellular alteration. Results are shown as a pseudo-segmentation map indicating the presence of the morphology of interest. h. Singlepatch prompting classification of basophilic and eosinophilic cellular alteration. Mean and standard deviation reported over ten single-patch prompts. Detailed performance metrics for all slide classification tasks are further provided in Materials and Methods. All models are trained on TG-18k and tested on TG-4k. Error bars in a,b,c represent 95% confidence intervals and were computed using non-parametric bootstrapping (100 iterations). Error bars in e,f,h represent standard deviation and were computed using classification performance repeated over 10 runs.

