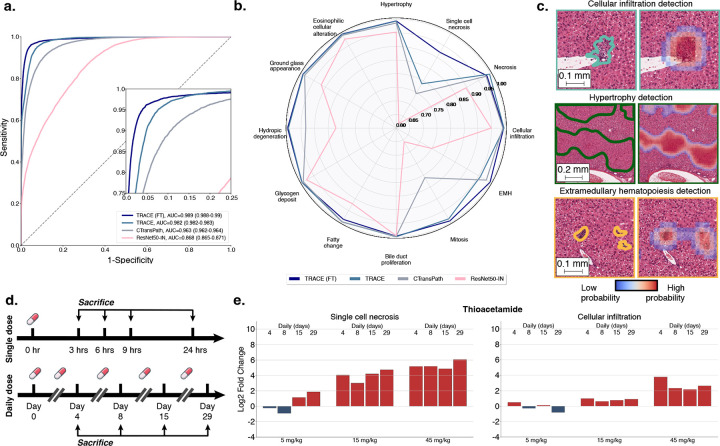
Figure 3: Patch-level lesion classification with TRACE fine-tuning.
a. AUROC and macro-AUC of TRACE fine-tuned (TRACE (FT)) compared to TRACE, CTransPath and ResNet50-IN across 12 lesions-of-interest. Models are trained on patch annotations from TG-18k and evaluated on patch annotations from TG-4k. 95% confidence intervals were reported using non-parametric bootstrapping (100 iterations). b. Class-wise predictions of TRACE (FT) and baselines evaluated using AUC. c. Patch prediction visualization on a test sample from TG-4k using 80% patch overlap. Heatmap overlay highlights regions with a high probability of being a lesion, colored contours highlight lesions annotated by pathologists. d. Overview of time-dose toxicity assessment. Each sample group (five animals) represents the administration of a specific compound at a predetermined drug dosage level, with a predefined frequency of dosing (single or daily administration) and a distinct interval of time between administration and sacrifice. A control group is used to identify background lesions. e. Morphological log2 fold change of single cell necrosis (left) and cellular infiltration (right) against the control group in thioacetamide using TRACE (FT) patch predictions with 80% patch overlap.

