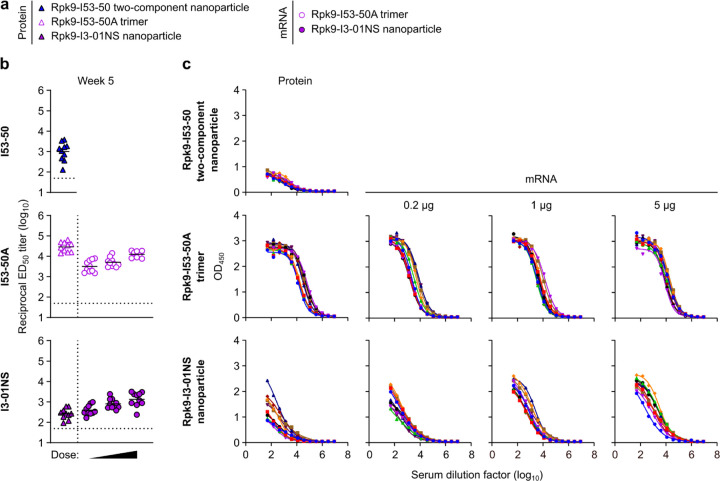
Extended Data Fig. 5. Anti-scaffold antibody titers in BALB/c mice two weeks post-boost.
a, Groups assessed for anti-scaffold responses at week 5 (from mice in Fig. 2). b, Serum antibody binding titers against the I53-50, I53-50A, and I3-01NS scaffolds. Each symbol represents an individual animal and the GMT from each group is indicated by a horizontal line. The dotted horizontal line represents the limit of detection for the assay. The dotted vertical line separates the protein and mRNA immunized groups. Statistical analyses have been omitted for clarity but can be found in Supplementary Information. c, Raw ELISA data and fits used to determine titers in (b). Each colored curve represents an individual animal.

