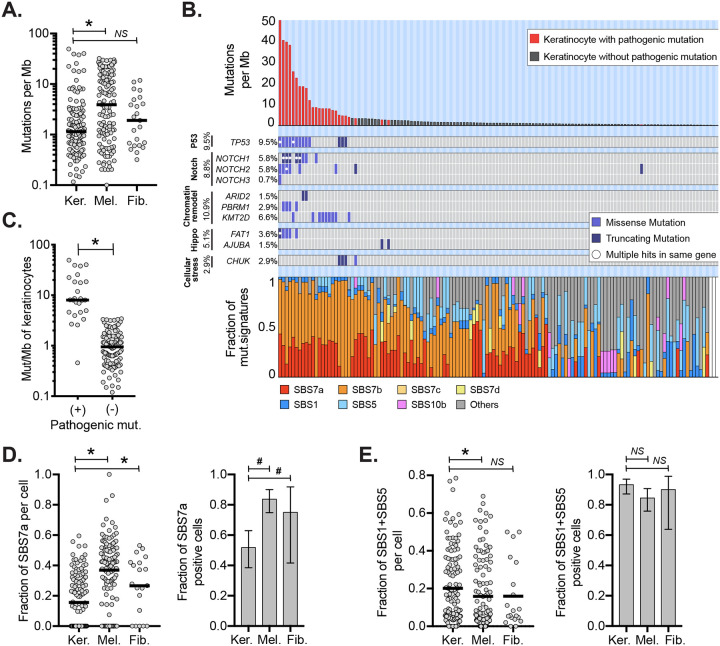
Figure 1. Keratinocytes have distinct mutational landscapes compared to other cell types.
A. Mutation burdens (mutations/megabase) of individual keratinocytes (Ker.) compared to melanocytes (Mel.) and fibroblasts (Fib.) B. Mutation burden, driver mutations, and mutational signatures for 137 keratinocytes with each column of the three stacked panels representing an individual cell. Top panel: mutation burden of keratinocytes in descending order. Red bars indicate cells harboring one or more pathogenic mutations. Middle panel: tiling plot of pathogenic mutations (rows). Bottom panel: the fractions of different mutational signatures for each cell. White bars indicate keratinocytes with too few mutations to perform signature analysis. C. Mutation burdens of keratinocytes with and without pathogenic mutations. D. Left panel: fraction of mutations with UV signatures (SBS7a) in keratinocytes, melanocytes, or fibroblasts. Right panel: fraction of cells with detectable SBS7a in keratinocytes, melanocytes, or fibroblasts. E. The data is plotted as in panel D but for SBS87. For all plots, an asterisk (*) or a hash (#) denotes p<0.05 using the Wilcoxon rank-sum test (cell to cell comparisons) or the Poisson test (proportion comparisons) respectively. Horizontal bars show the median (panels A and C) or mean (panels D and E). Error bars in panels D and E show 95% confidence intervals (Poisson test).

