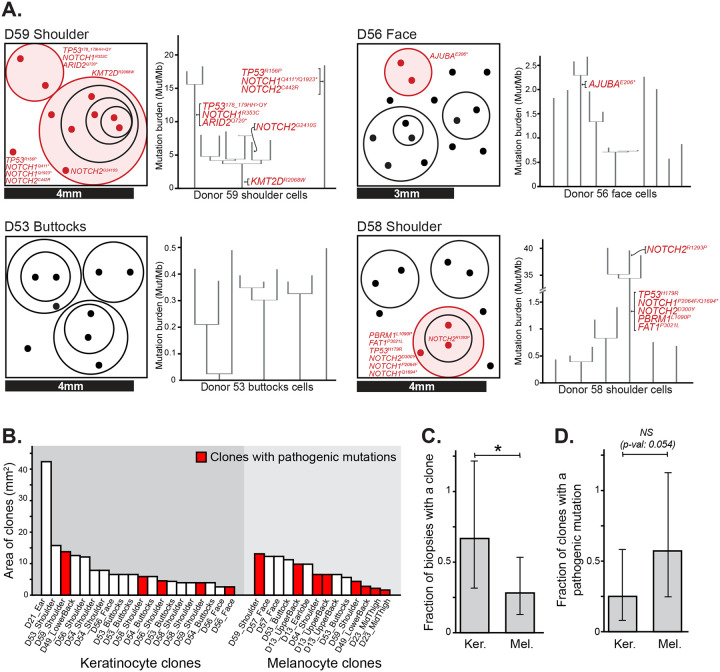
Figure 2. Clonal architecture of keratinocytes in human skin.
A. Clonal structure of keratinocytes from four representative skin biopsies (see Fig. S5 for all biopsies). The surface area of each biopsy is drawn to scale, as indicated, with dots representing the cells genotyped from each biopsy. The circles group phylogenetically related cells, with pathogenic mutations labeled in red. To the right of each schema, the corresponding phylogenetic trees, rooted in the germline state, are shown for all cells from that biopsy. B. The area occupied by individual clones was calculated from the size of each biopsy and the proportion of cells attributed to each clone. Clone areas are shown for keratinocytes and melanocytes with clones harboring pathogenic mutations indicated in red. C-D. Fraction of biopsies with a detectable clone (panel C) and fraction of clones with an underlying pathogenic mutation (panel D), separately plotted for keratinocytes (Ker.) and melanocytes (Mel.). * denotes p<0.05 (Poisson test).

