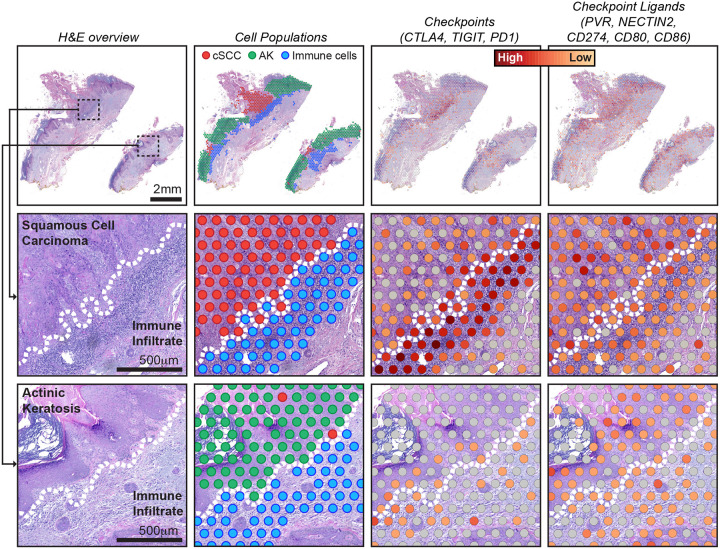
Figure 5. Spatial heterogeneity in gene expression of immune cells at the interface of squamous cell carcinoma versus actinic keratosis.
Each column of images shows a different view of spatial transcriptomic data from case BB05, including: an H&E overview, annotated spots, and gene expression of immune checkpoints and their ligands. See figure S12 for an overview of other cases. Gene expression intensities represent the combined expression of the checkpoint or ligand genes listed. Zoomed insets show the interface of tumor epithelia and immune cells, illustrating different levels of checkpoint and ligand expression in squamous cell carcinoma versus actinic keratosis. Dotted lines indicate the tumor/immune boundary.

