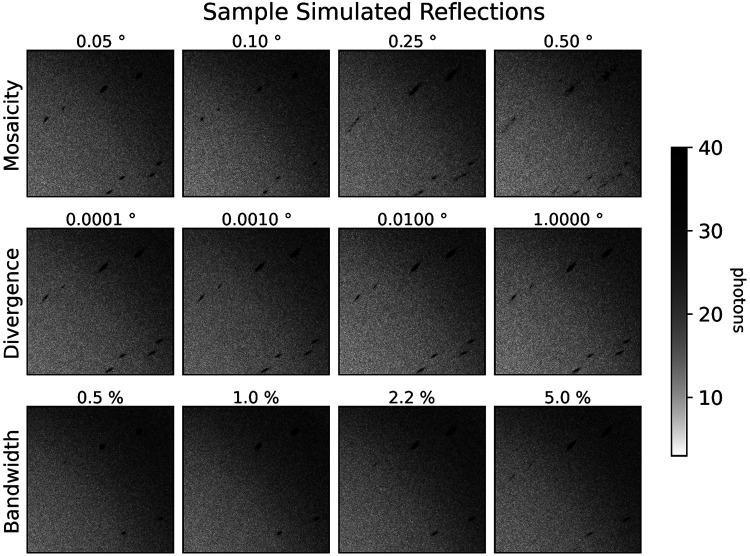
FIG. 2. Dependence of spot profiles on simulated crystal parameters.
Close-ups of synthetic diffraction patterns for dihydrofolate reductase, generated by nanoBragg for different levels of crystal mosaicity, beam divergence, and beam spectral bandwidth. An input BioCARS spectrum of 5.5% bandwidth at full-width half-maximum is used for all simulations except those that vary bandwidth, which use a simulated Gaussian spectrum with the same center and varying bandwidths. The reference data set here is labeled with 0.1° mosaicity, and uses the input BioCARS spectrum with 0.1° beam divergence. Each other data set differs from that data set by only the associated label.

