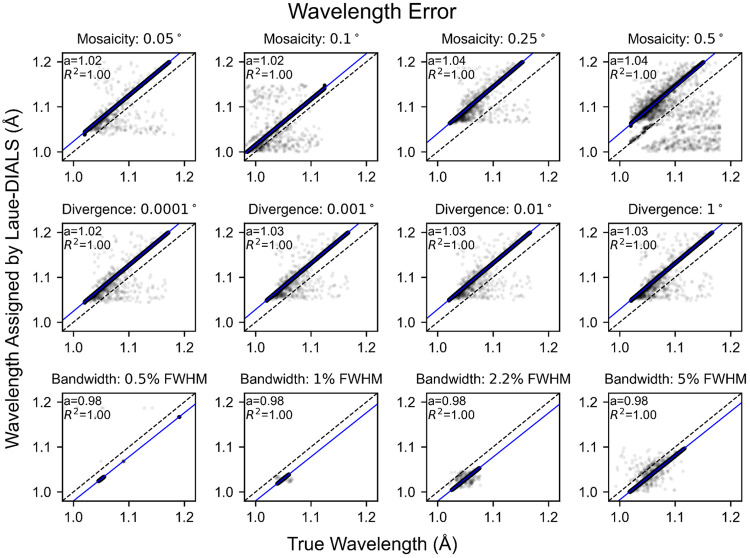
FIG. 5. Wavelength errors for processing simulated data.
Scatter plots of the simulated wavelengths and wavelengths assigned to reflections by Laue-DIALS. Each subplot has the line plotted in black for reference and includes a least-squares linear regression (blue) with the slope and correlation coefficient . The intercept is set to . Titles for each subplot denote the key parameter difference from the reference data set, which is marked with “Mosaicity: 0.1°.” Plots with differing bandwidths use a Gaussian spectrum with the labeled bandwidth. All other plots use a spectrum derived from the BioCARS beamline with approximately 5.5% bandwidth at FWHM. Beam divergence is 0.1° unless otherwise specified.

