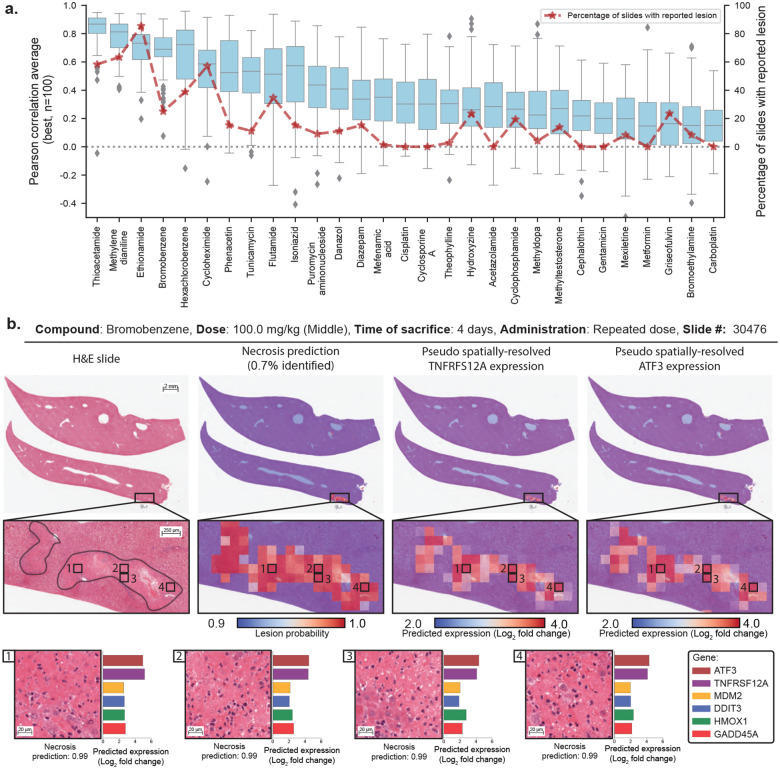
Figure 2: Gene expression profiling from whole-slide images using GEESE.
a. Gene expression prediction of the top 100 best-predicted genes evaluated using Pearson correlation and stratified by compound from the test set. The percentage of slides with lesions is displayed in red. Boxes indicate quartile values of gene-level Pearson correlation, with the center line indicating the 50th percentile. Whiskers extend to data points within 1.5× the interquartile range. b. Example of a liver section after exposure to bromobenzene (left). Overlay of patch-level necrosis prediction. Predictions below 90% confidence are represented in blue, and high-probability predictions are represented in red (center-left). Pseudo spatially-resolved gene expression heatmaps of genes TNFRSF12A (center-right) and ATF3 (right). Examples of high-probability necrotic patches from the slide pseudo gene expression of ATF3, TNFRSF12A, MDM2, DDIT3 (also known as CHOP), HMOX1, and GADD45A (bottom).

