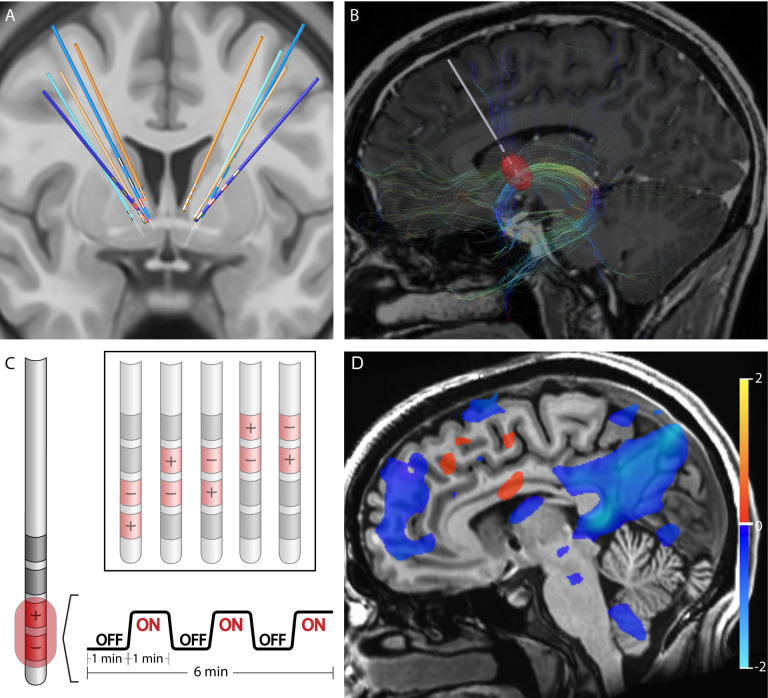
Figure 1: Structural and Functional Characterization of DBS Configurations.
A) Reconstruction of DBS leads for five subjects. Leads for separate patients are in distinct colors. Blue leads indicate treatment responders; orange leads indicate non-responders. Therapeutic electrode contacts shown in red. B) Example of tractography derived from diffusion imaging seeding the estimated volume of tissue activation for a therapeutic bipolar contact configuration for a single representative subject. C) Design of DBS cycling On vs Off paradigm during fMRI acquisition for different stimulation configurations. D) fMRI BOLD changes with DBS On vs Off for same subject and configuration in B. Suppression of BOLD with DBS On vs Off is depicted in blue while activation with DBS On vs Off is depicted in red. Color bar indicates percentage change in BOLD signal. p<0.05; OLSQ.

