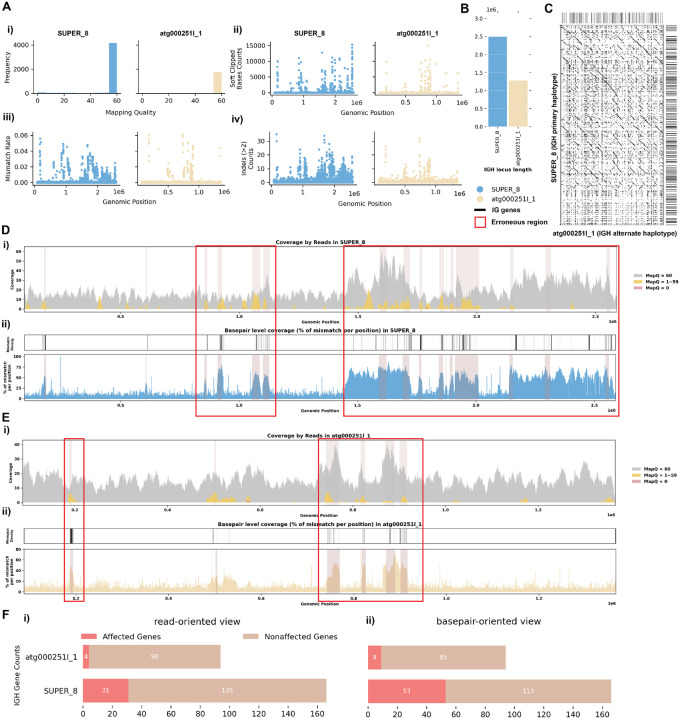
Figure 2. Detailed Analysis of IGH Locus Assembly Errors in Greenland wolf (C. lupus) individual 1.
A. Summary statistics of the read alignment situation are depicted, showing mapping quality across IGH loci for both haplotypes, with blue representing the primary assembly and yellow the alternate. i) The plots illustrate the read mapping quality frequency, ii) count of soft clipped bases, iii) mismatch rates of reads, and iv) number of indels (consecutive length of at least 2 bp) for both haplotypes across IGH loci. B. IGH locus length in both the primary and alternate assemblies are compared using bar charts. C. Dotplots comparing gene locations and alignments are shown for primary vs alternate haplotypes. We generated dotplots using Gepard(v2.1) (69). D. A detailed analysis of alignment mismatch in the primary IGH haplotype includes i) read coverage across the entire IGH loci, color-coded by mapping quality, and ii) basepair-oriented mismatch rate, a heatmap above indicating the frequency of high mismatch rate base pairs, with darker colors denoting more frequent occurrences. Light red highlights positions covered by ≥5 reads with an error rate >1%, and purple bars indicate coverage breaks (coverage ≤2). E. Similar analysis to D for the alternate IGH haplotype. F. IG gene quality from i) read-oriented view, affected genes are IGH genes covered by > 5 poorly aligned reads; and ii) basepair-oriented view, affected genes are IGH genes without perfect support (>80% confidence at every position)

