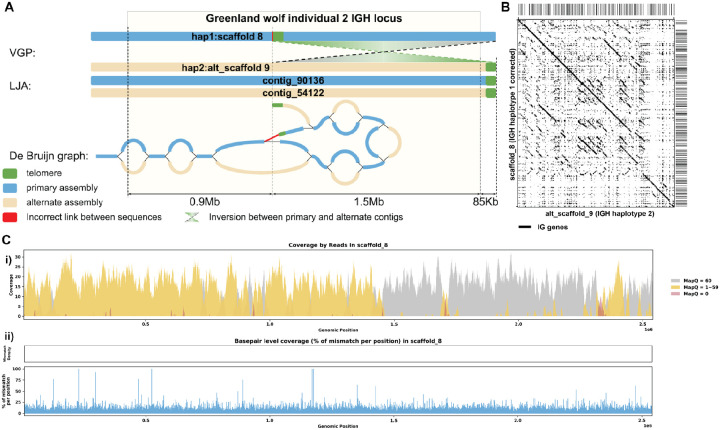
Figure 7. Reassembly Analysis of IGH Locus Assembly Errors in C. volans. Individual 2.
A. Primary and alternate sequences of IGH locus in VGP and LJA assemblies of C. lupus individual 2 are represented by blue (primary) and tan (alternate) rectangles. Telomere sequences (tandem repeats with repeating sequence CCCTAA) are shown in green. Contigs produced by VGP for this region differ by a 1.5Mbp inversion. This inversion puts the telomeric sequence highlighted in green into the middle of contig SUPER_8. Red link corresponds to the inversion breakpoint. It does not have significant support by reading. B. Dotplots comparing gene locations and alignments are shown for the corrected haplotype 1 IGH assembly vs haplotype 2 IGH assembly. C. Re-analysis of alignment mismatch in the corrected haplotype 1 IGH assembly, i) read coverage across the entire IGH loci, color-coded by mapping quality, and ii) basepair-oriented mismatch rate, a heatmap above indicating the frequency of high mismatch rate base pairs, with darker colors denoting more frequent occurrences. Light red highlights positions covered by ≥5 reads with an error rate >1%, and purple bars indicate coverage breaks (coverage ≤2).

