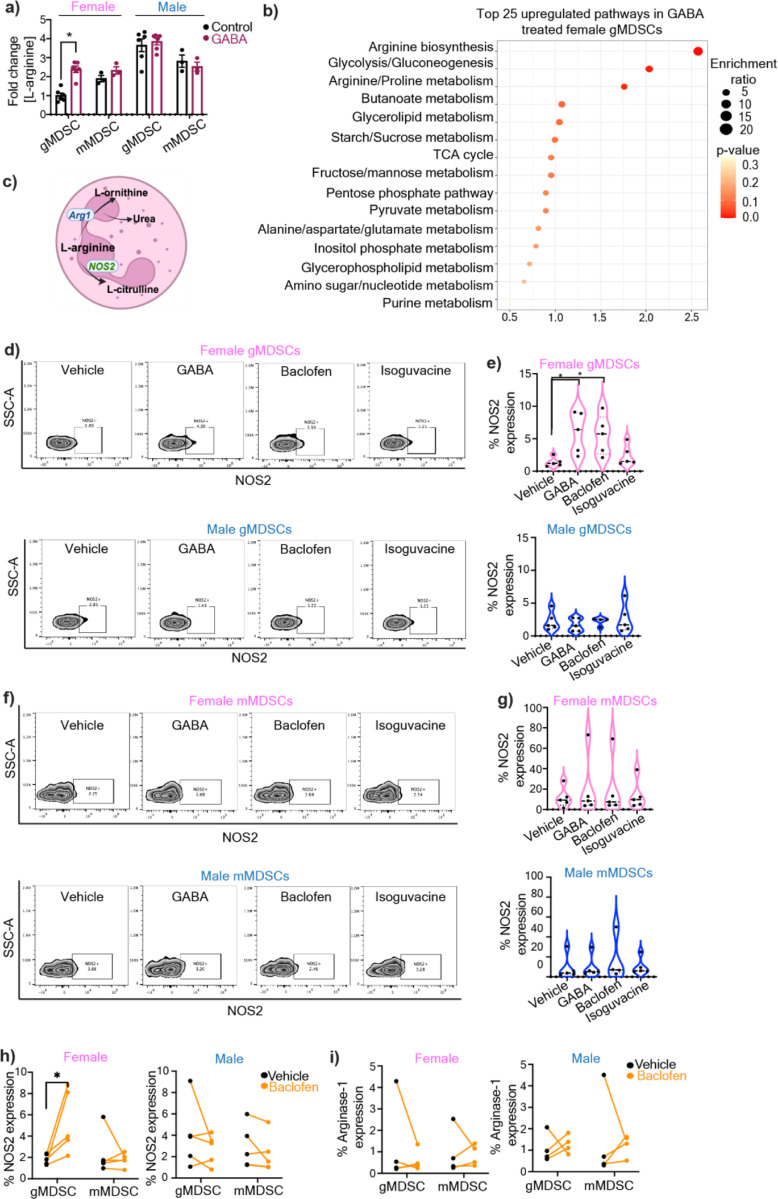
Figure 2: GABA metabolically alters female gMDSCs through upregulation of L-arginine.
a) gMDSCs (CD11b+Ly6G+Ly6C-) and mMDSCs (CD11b+Ly6G-Ly6C+) from male and female mouse were sorted from bone marrows and treated with 100 µM GABA overnight. Relative L-Arginine levels in female and male gMDSCs (n=6) and mMDSCs (n=3) following GABA treatment were determined by mass spectrometry. *p<0.01 as determined by 2-way ANOVA b) Graphical representation depicting the metabolic conversion of L-arginine to L-ornithine and L-citrulline by Arginase-1 (Arg-1) and nitric oxide synthase 2 (NOS2), respectively. Male and female mouse MDSCs were treated with 100 µM GABA, baclofen, isoguvacine or PBS (vehicle) overnight. c) NOS2 expression was analyzed by flow cytometry. Representative contour plots demonstrating the change in NOS2 expression in gMDSCs with GABA, baclofen, and isoguvacine treatment. d) Violin plots showing the percentage of NOS2 expression in female (pink, top) and male (blue, bottom) mouse gMDSCs (n=4–5). *p< 0.05 as determined by unpaired t-test. e) Representative contour plots demonstrating the change in NOS2 expression in mMDSCs with GABA, baclofen, and isoguvacine treatment. f) Violin plots depicting the percentage of NOS2 expression in female (pink, top) and male (blue, bottom) mouse mMDSCs (n=4–5). g) Representative contour plots demonstrating the change in Arg1 expression in gMDSCs with GABA, baclofen, and isoguvacine treatment. h) Violin plots showing the percentage of Arg1 expression in female (pink, top) and male (blue, bottom) mouse gMDSCs (n=4). i) Representative contour plots demonstrating the change in Arg1 expression in mMDSCs with GABA, baclofen, and isoguvacine treatment. j) Violin plots depicting the percentage of Arg1 expression in female (pink, top) and male (blue, bottom) mouse mMDSCs (n=4). Human PBMCs were treated with 100 μM baclofen or PBS (vehicle) overnight and expression of NOS2 and Arg-1 analyzed by flow cytometry. The frequency of k) NOS2 (n=5) and l) Arg-1 (n=4) expressing gMDSCs versus mMDSCs from female (left) and male (right) donors. *p<0.05 as determined by paired t-test.

