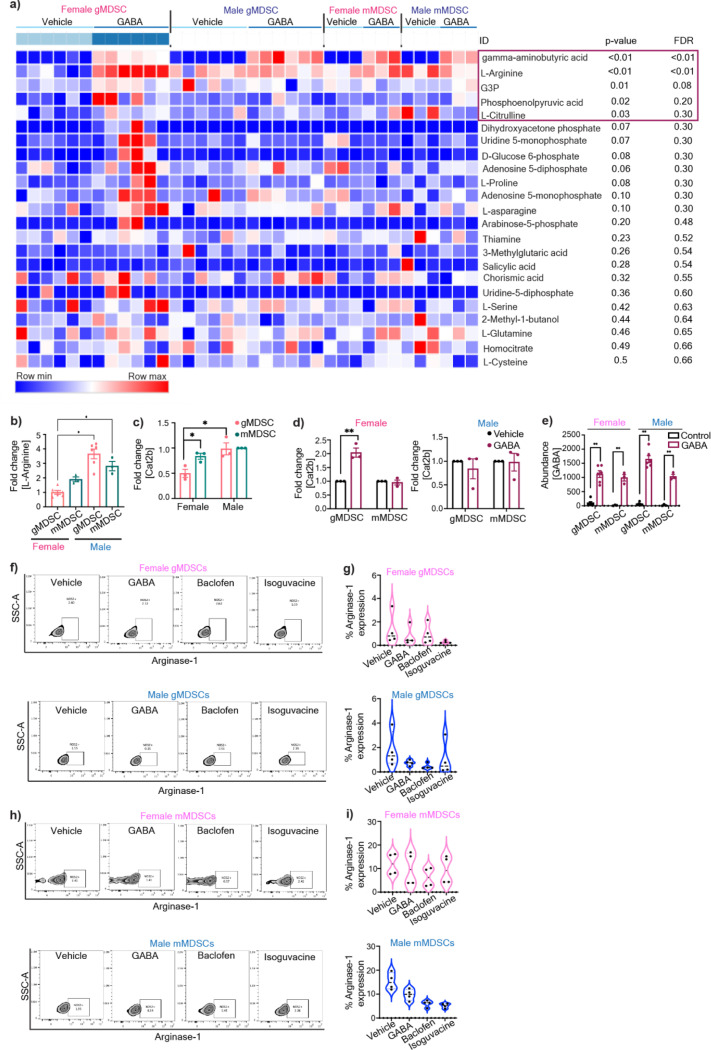
Extended Figure 2: GABA-mediated metabolic alteration of female gMDSCs.
a) Heatmap demonstrating differentially regulated metabolites in male and female mMDSCs and gMDSCs upon GABA stimulation. Data was normalized to the average sum of metabolites from all the samples and analyzed using Morpheus. b) Relative baseline L-Arginine levels in female and male gMDSCs (n=6) and mMDSCs (n=3), *p<0.01 as determined by two-way ANOVA. c) Relative expression of the L-Arginine transporter Cat2b in male and female mMDSC and gMDSC. d) Change in the frequency of Cat2b expression in female (left) and male (right) MDSCs treated with 100 μM GABA. n=3, * p<0.05 by unpaired t-test compared to vehicle. e) Enrichment plots depicting the top 25 pathways upregulated in female gMDSCs with GABA stimulation. f) Intracellular abundance of GABA in female and male gMDSCs (n=6) and mMDSCs (n=3) following GABA treatment, *p<0.01 as determined by two-way ANOVA.

