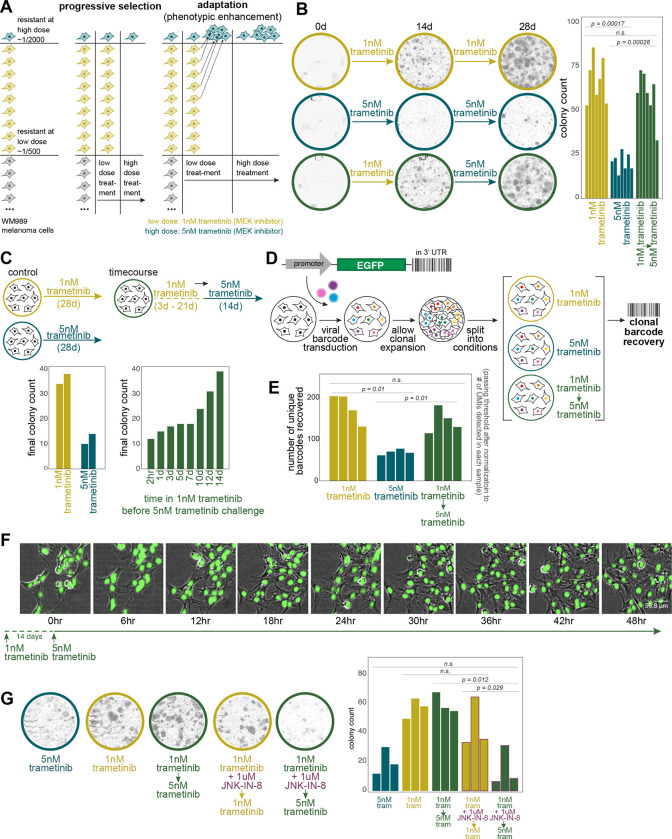
Figure 2: Dose-escalation experiments reveal AP-1-dependent cellular adaptation during the acquisition of therapy resistance.
(A) Schematic of dose-escalation experimental design to differentiate a purely selective process from an adaptive one.
(B) Representative images of colonies at approximately day 0 (therapy initiation), day 14 (dose-switch), and day 28 (endpoint) for low dose alone, high dose alone, and low-to-high-dose switch conditions. Quantification of resistant colonies under different treatment conditions. Bar plots show the average number of resistant colonies from 7 biological replicates after 4 weeks of treatment. Error bars represent standard error (SE). Statistical significance was determined using one-way ANOVA followed by Shapiro-Wilk’s test for normality of residuals and Levene’s test for homogeneity of variance. Statistical significance was determined using one-way ANOVA followed by Shapiro-Wilk’s test for normality of residuals and Levene’s test for homogeneity of variance. Post-hoc comparisons were performed using paired t-tests. This statistical approach was applied across all panels in this figure.
(C) Time course of adaptation. Left: Bar plots comparing the number of resistant colonies under continuous low-dose versus high-dose conditions (two technical replicates in each condition). Right: Bar plots showing the number of resistant colonies when switching to high dose after varying durations of low dose exposure.
(D) Schematic of DNA barcoding lineage tracking experiment. Cells were barcoded, grown for 4–5 divisions, and then split between 6 arms, each of which was treated as depicted.
(E) DNA barcode analysis of individual cellular clones. Bar plot showing the number of unique barcodes detected across different treatment conditions. Each bar represents a biological replicate (n=4). Barcode counts are normalized to the number of Unique Molecular Identifiers (UMIs) detected for each sample.
(F) High-frequency live imaging of a therapy-resistant colony during dose escalation. 48-hour time-lapse images of a colony of H2B-GFP labeled WM989 A6-G3 melanoma cells (WM989 A6-G3-A10) following 14 days of low dose (1nM) trametinib treatment. The first time point shown (0hr) indicates the moment the dose was escalated to 5nM trametinib. Images were captured every 6 hours; images shown are overlays of phase contrast and GFP (nuclei) channels.
(G) Effect of AP-1 inhibition on cellular adaptation. Left: Representative whole-well images at day 28 (endpoint) showing colony formation under different conditions. Right: Bar plot quantifying final colony counts for each condition. Each bar represents a biological replicate (n=3).

