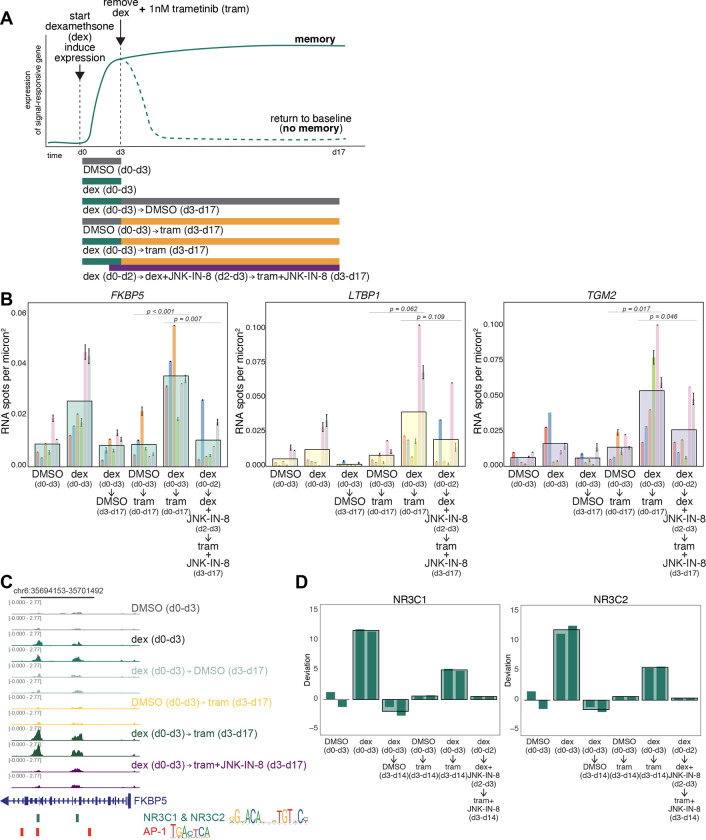
Figure 3: Passenger memory formation in WM989 melanoma cells during resistance acquisition.
(A) Schematic of the hypothesis that the transition from primed to fully resistant cell induces the formation of cellular memories of the state of the cell at the time of therapy application (top); corresponding experimental design (bottom)
(B) Single-molecule RNA FISH quantification of FKBP5, TGM2, and LTBP1 expression under control and experimental conditions. Large bars represent the mean for each condition, with a total of 602–806 cells analyzed for each condition. Smaller underlying bars show 6 biological replicates, color-coded consistently across conditions and genes. Error bars indicate standard error of the mean (SEM). Statistical significance was determined using one-way ANOVA followed by Shapiro-Wilk’s test for normality of residuals and Levene’s test for homogeneity of variance. Post-hoc comparisons were performed using paired t-tests.
(C) Example track showing peak changes in conditions described in panel A for the promoter region of FKBP5.
(D) Bar graphs of chromVAR deviation z-scores demonstrating changes in transcription factor signatures for NR3C1(left) and NR3C2 (right). Large bars represent the mean for each condition and smaller underlying bars show the 2 replicates. All experimental conditions shown in Supp. Fig. 4D

