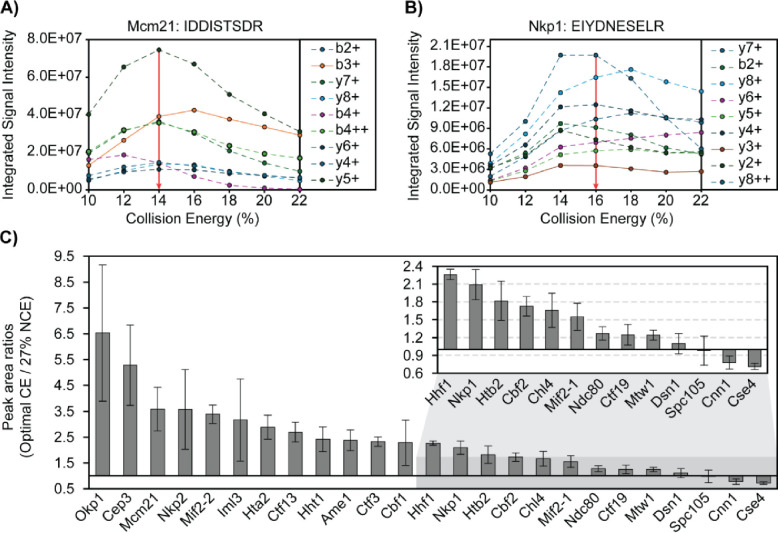
Figure 2. Collision energy is optimized for each CKP peptide to improve signal intensity and transition heterogeneity.
A & B) Representative breakdown curves of IDDISTSDR (Mcm21 peptide) and EIYDNESELR (Nkp1 peptide): The peak areas of the top 9 most abundant product ions were plotted against %CE to illustrate the changes in fragmentation patterns of the peptide in response to changes in collision energies. C) Peak area ratios of product ions before and after CE optimization: The mean peak area of each peptide’s most abundant product ions (sum of peak areas of the top 10 most abundant product ions) across 3 analytical replicates were plotted for injections using either 27% NCE for all peptides or optimal CEs (see Table 2). Mean peak area ratios were plotted in descending order as grey bars and standard deviations were plotted as error bars. The x-axis intersects the y-axis at y = 1, which indicates no improvement of product ion signal intensity from CE optimization.

