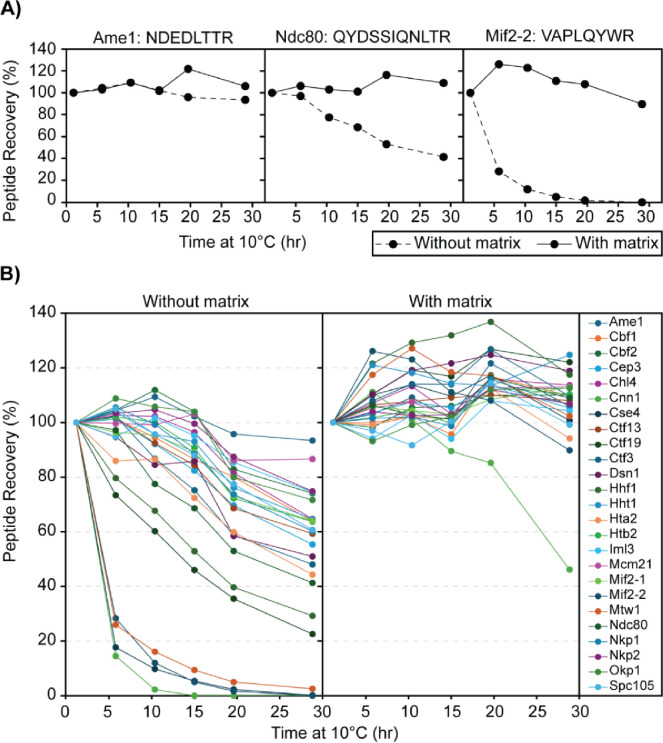
Figure 3. Effects of stabilization matrix on peptide recovery.
A) Representative peptide recovery profiles over time: No matrix (0.1% TFA) - solid line; With matrix (0.1% TFA with 50 ng/μL digested yeast cytosolic proteins) - dashed line. The peptides’ sequences are labeled on the top of each panel. The y-axis shows the percentage recovery of the peptide by peak area in comparison to the first time point (1 hour at 10°C), and the x-axis shows the amount of time that the digested CKP was left at 10°C before injection into the MS. B) Recovery profiles of all CKP peptides: As above, the percentage recovery of each peptide was plotted against time. Each peptide is marked by a different color, as indicated by the legend key on the right-most panel.

