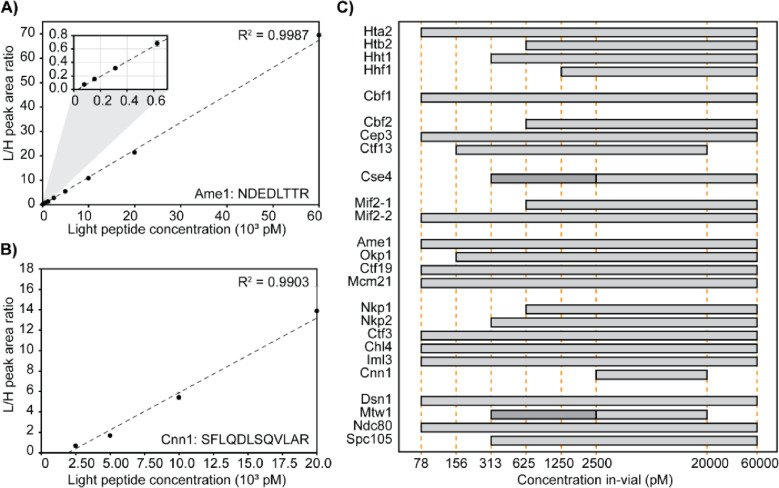
Figure 4. Linearity and limits of quantification.
A & B) Representative calibration curve of the Ame1 peptide (NDEDLTTR) and the Cnn1 peptide (SFLQDLSQVLAR). In-vial concentrations (pM) are shown on the x-axis, and the peak area ratio between L-CKP and H-CKP is plotted on the y-axis. A zoom region inset of the plot is appended in the top left corner to show the curve fitting at the lower calibrators. C) AMRs of all CKP peptides: The AMRs of CKP peptides are plotted as grey bars on a log10 scale. Orange dashed lines intersecting the x-axis indicate calibrator concentrations (pM). Dark grey bars indicate the lower AMRs of Cse4 and Mtw1 peptides.

