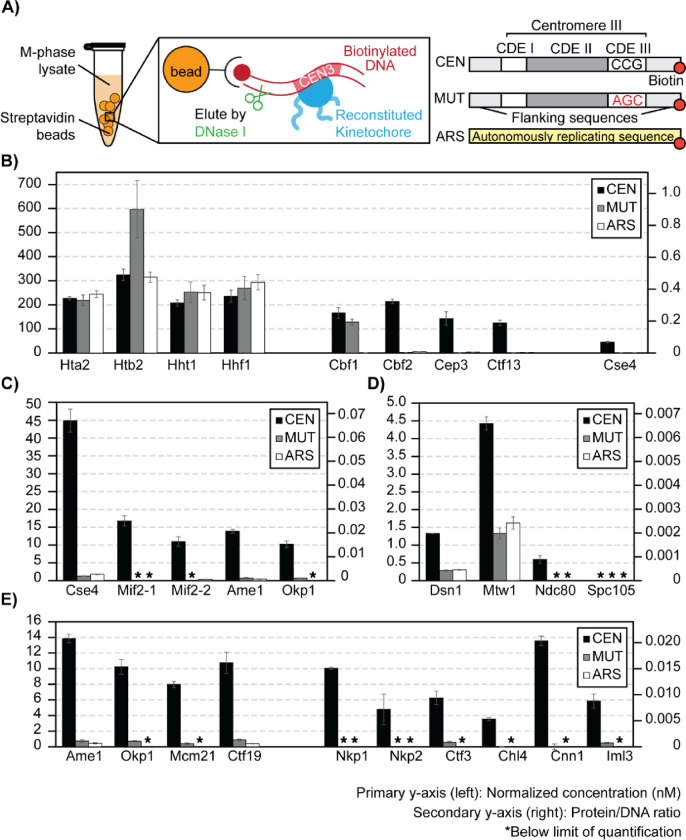
Figure 5. Stoichiometry of M-phase yeast kinetochores.
A) Right: schematics of ex vivo kinetochore reconstitution using yeast whole cell extracts (WCEs); Left: DNA maps for the 3 types of DNA used. B) Quantification of ex vivo reconstituted nucleosomes, Cbf1, and the Cbf3 complex: The primary y-axis (left) shows the normalized concentration of proteins (see method). The secondary y-axis (right) shows the amount of each protein as a ratio to the total amount of DNA on beads. The standard deviation of 3 process replicates (3 ex vivo reconstitutions done in parallel) are plotted as error bars around their averages. Quantifications are only made when the measurement falls within the AMRs defined in Figure 4. * Indicates signals below the lower limit of quantification. C) Quantifications of ex vivo reconstituted essential yeast inner kinetochore proteins: Cse4, Mif2, Ame1, and Okp1. D) Quantifications of ex vivo reconstituted outer kinetochore subunits: Dsn1, Mtw1, Ndc80, Spc105. E) Quantifications of ex vivo reconstituted COMA complex and Ctf3 complex members.

