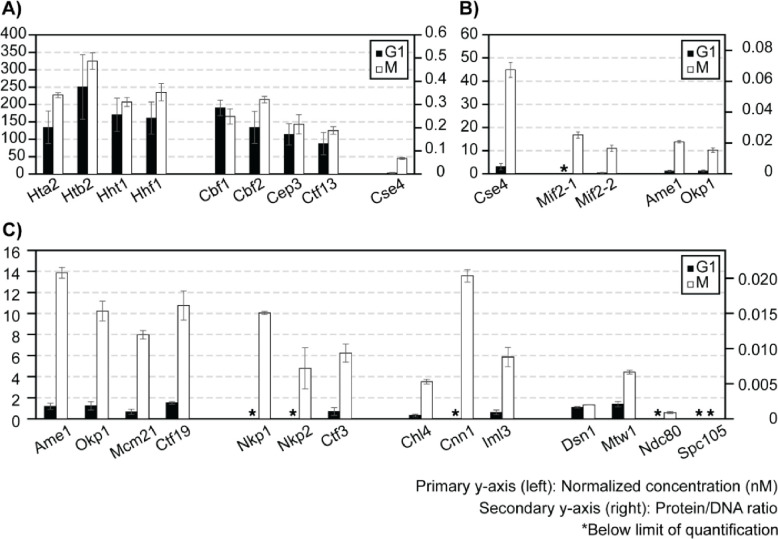
Figure 6. Effect of cell cycle on ex vivo reconstituted kinetochores.
A-C) Quantifications of ex vivo reconstituted kinetochore subunits when using G1 or M-phase lysates: y-axes are defined as in Figure 5. The plot shows only the results for CEN-DNA reconstituted kinetochores. See S8 Figure for MUT-DNA data of G1-phase reconstituted kinetochores.

