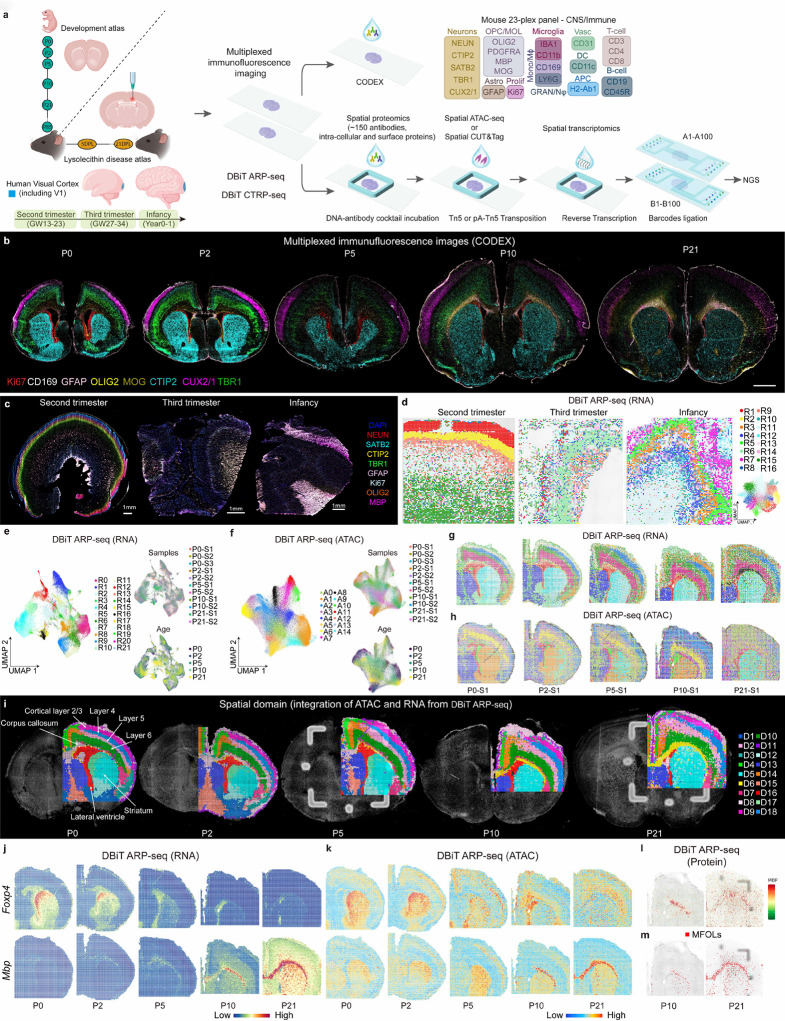
Fig. 1: Spatial epigenome–transcriptome–proteome mapping of the developing mouse and human brains at the onset of myelination.
a, Schematic workflow. b, CODEX images of whole mouse brains at P0 to P21. Scale bar, 1 mm. c, CODEX images of human brain V1 region at second trimester, third trimester, and infancy. Scale bar, 1 mm. d, UMAP and spatial distribution of spatial RNA clusters of the human brain samples at different stages. e, UMAPs of the mouse brain spatial RNA clusters at different ages from P0 to P21. f, UMAPs of the mouse brain spatial ATAC clusters at different ages from P0 to P21. g, Spatial distribution of RNA clusters in e. h, Spatial distribution of ATAC clusters in f. i, Spatial domain of the mouse brains generated by the integration of RNA and ATAC data in DBiT ARP-seq. j-k, Spatial mapping of gene expression (j) and gene activity score (GAS) (k) of Foxp4 and Mbp for ATAC and RNA in DBiT ARP-seq. l, MBP expression from ADT protein data in DBiT ARP-seq. m, Label transfer of MFOLs from scRNA-seq24–26 to P10 and P21 mouse brains.

