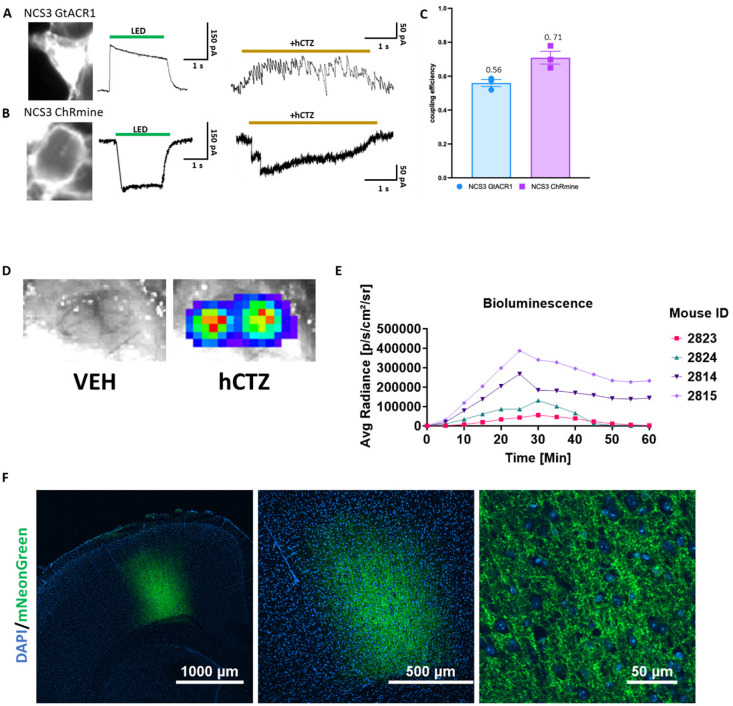
Figure 2. Efficient circuit manipulation by excitatory and inhibitory luminopsins.
(A-B) Fluorescent images of LMO-expressing HEK293 cells (left), photocurrent patch clamp traces (middle), and luciferin-induced patch clamp traces (right) for NCS3 – GtACR1 (A) and NCS3 – ChRmine (B). (C) Coupling efficiency of NCS3 - GtACR1 and NCS3 – ChRmine (n = 3/group). (D) Bioluminescence in vivo signal imaged through an open skull from a mouse bilaterally transduced with AAV-EfIa-DIO-NCS3-hGtACR1 following IP delivery of vehicle (left) and hCTZ (right). Exposure time was 1 sec. (E) Bioluminescence emission over time. Images were taken for 1 sec every 5 minutes for 60 minutes after IP injection for 4 individual mice transduced with NCS3-GtACR1 (mouse 2824 and 2814) and NCS3-ChRmine (mouse 2823 and 2815). (F) Fluorescence confocal images of cortical sections showing robust LMO expression (NCS3-ChRmine) at 4x, 10x, and 60x objectives with magnifications as indicated (DAPI = blue, mNeonGreen = green).

