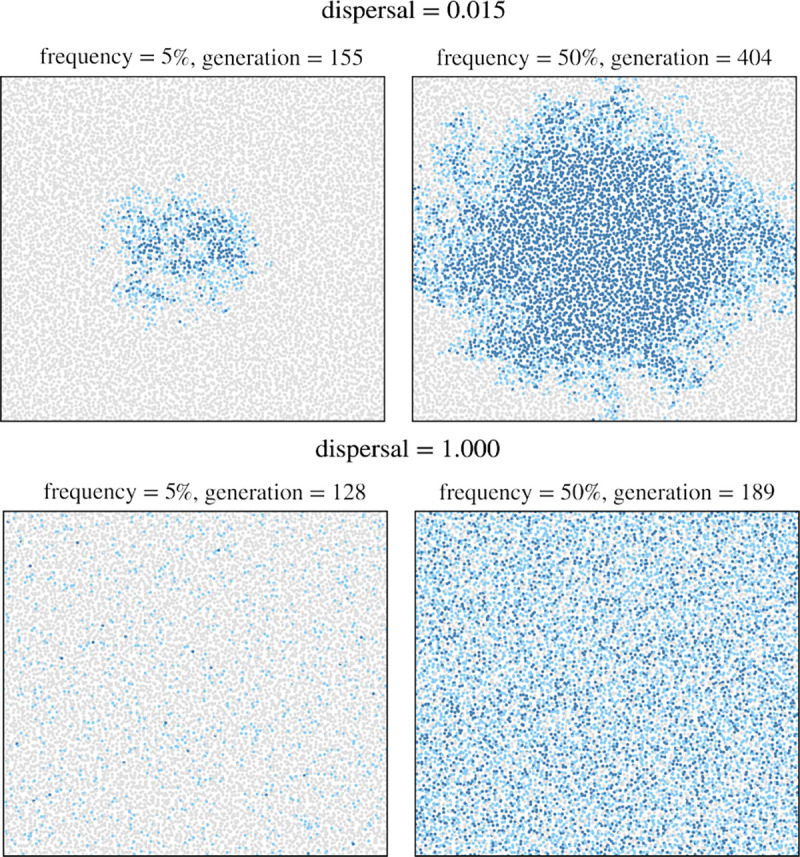
Figure 3.

Qualitative illustration of sweep dynamics under limited-dispersal (top row, ) versus panmixia (bottom row, ). Each row shows two population snapshots, taken when the adaptive mutation first reached a population frequency of 5% (left) and 50% (right). Light blue points represent heterozygous individuals, while dark blue points represent homozygous individuals. The adaptive mutation had a selection coefficient of and was introduced close to the center of the habitat.
