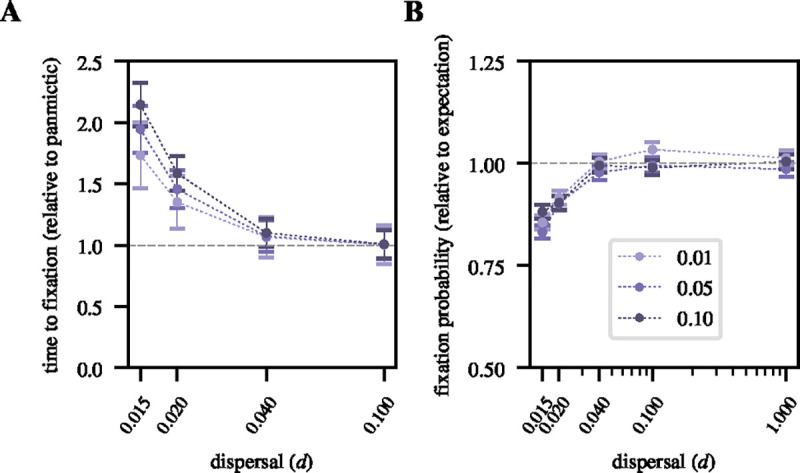
Figure 4. Fixation times and probabilities:

A. Ratio of the average sweep fixation time for varying dispersal rates relative to the average fixation time under panmixia. Error bars represent the standard deviation from the mean, estimated over ~ 3000 successful sweeps per data point. B. Ratio of the fixation probability of a new adaptive mutation with selection coefficient s for varying dispersal rates relative to the expected fixation probability under panmixia . Each data point was estimated from ~ 3000 successful sweeps. Error bars represent the binomial sampling error, calculated as
