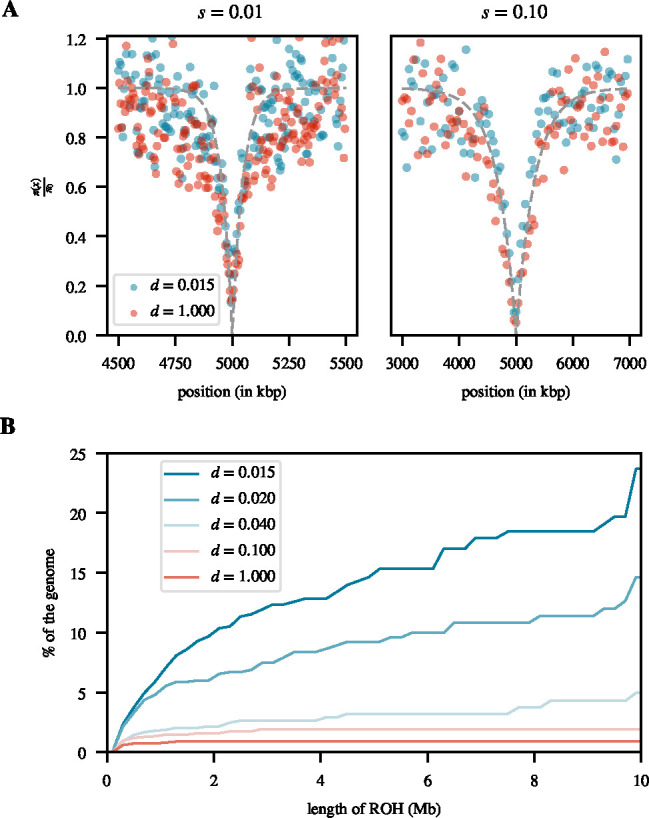
Figure 5. Sweep sizes and ROH distributions:

A. Reduction in heterozygosity around the sweep locus estimated at sweep fixation relative to the neutral level before the sweep for the two extreme dispersal rates and , and for selection strengths of (left) and (right). For the left plot, each data point was estimated over a non-overlapping window of size 5 kbp, averaged over 1000 replicates. For the right plot, each data point was estimated over a non-overlapping window of size 40 kbp, averaged over 1000 replicates. The grey dashed line represents the panmictic expectation of , where is the distance from the sweep locus (Barton (2000)). B. Cumulative proportion of a diploid genome covered by ROHs as a function of the maximum length of ROHs considered. For each value of , the result represents an average across samples from three neutral burn-in replicates. A minimum length of 200 kbp is used for calling ROHs.
