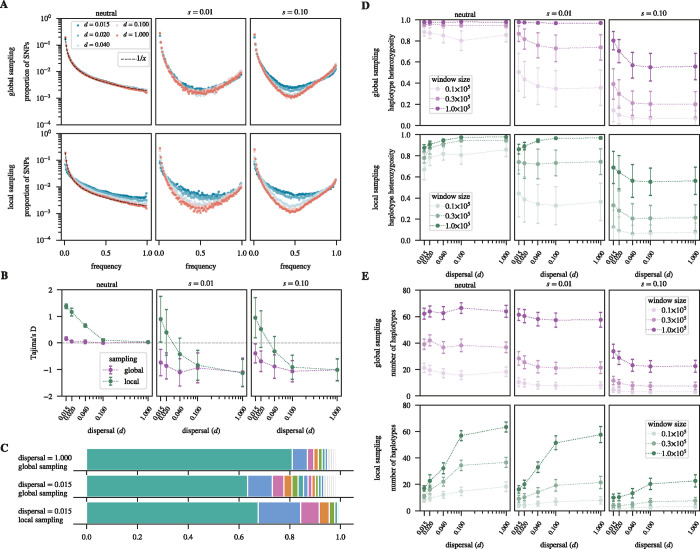
Figure 6. Softening of hard selection sweeps under limited dispersal:
A. Site frequency spectra under neutrality and two sweep strengths for varying dispersal rates. For the neutral simulations, the spectra were estimated across the entire simulated chromosome of length 10 Mbp. For the sweep scenarios, the windows were centered on the sweep locus, with their sizes chosen to capture the average dip in diversity (150 kbp for , and 1 Mbp for ). B. Tajima’s values for each of the spectra estimated above. Values of correspond to the neutral equilibrium expectation (grey dashed line); negative values indicate a skew towards low- and/or high-frequency derived variants; positive values indicate enrichment for intermediate-frequency variants. C. Haplotype frequency spectra for selective sweep simulations of strength within a window of size 50 kbp centered on the sweep for the panmictic limit and the low-dispersal limit , and estimated in global versus local samples. Each haplotype frequency spectrum was averaged over 1000 sweeps. D. Haplotype heterozygosity under neutrality and two selection strengths for varying dispersal rates, different window sizes, and global versus local sampling. E. Same as D, but showing the overall number of haplotypes present in the analysis window instead of haplotype heterozygosity. The mean and standard deviation (represented by the error bars) of each data point in B,D,E were estimated across 1000 replicates.

