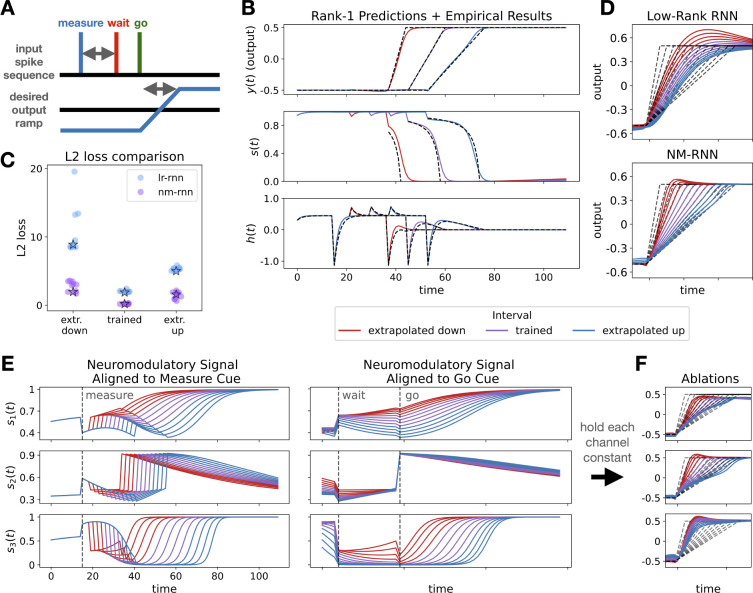
Figure 3:
A. Visualization of Measure-Wait-Go task. B. Theoretical predictions (dashed lines) match closely with empirical results (solid lines) for rank-1 network. C. L2 loss comparsion for parameter-matched LR-RNNs and NM-RNNs. Performance of visualized models are starred. D. Comparison of model-generated output ramps for both trained and extrapolated intervals. E.Three-dimensional neuromodulatory signal s(t) for trained/extrapolated intervals. Left, traces are aligned to start of trial. Right, traces are aligned to ‘go’ cue. F. Resulting output traces when ablating each component of s(t). In all panels, colors reflect trained/extrapolated intervals (see legend). For output plots, dashed grey lines are targets. Additional model visualizations in figs. S1 and S2.

