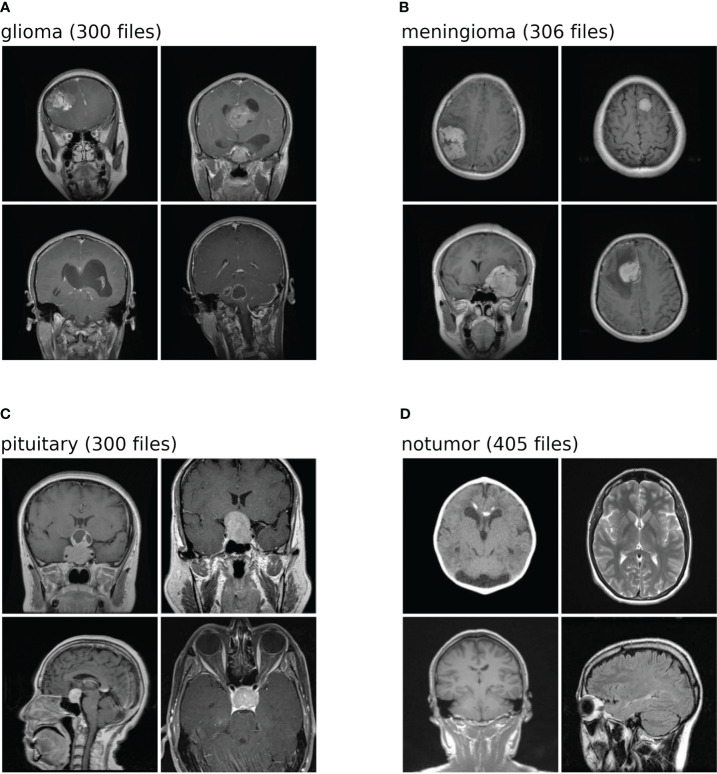
Figure 2.
Shows the dataset comprises images of four distinct classes. Each class is identified by a specific label: (A) denotes glioma; (B) corresponds to meningioma; (C) represents pituitary; (D) signifies no tumor. The numeric values associated with each class label is the number of test images within the dataset for brain tumor classification task.

