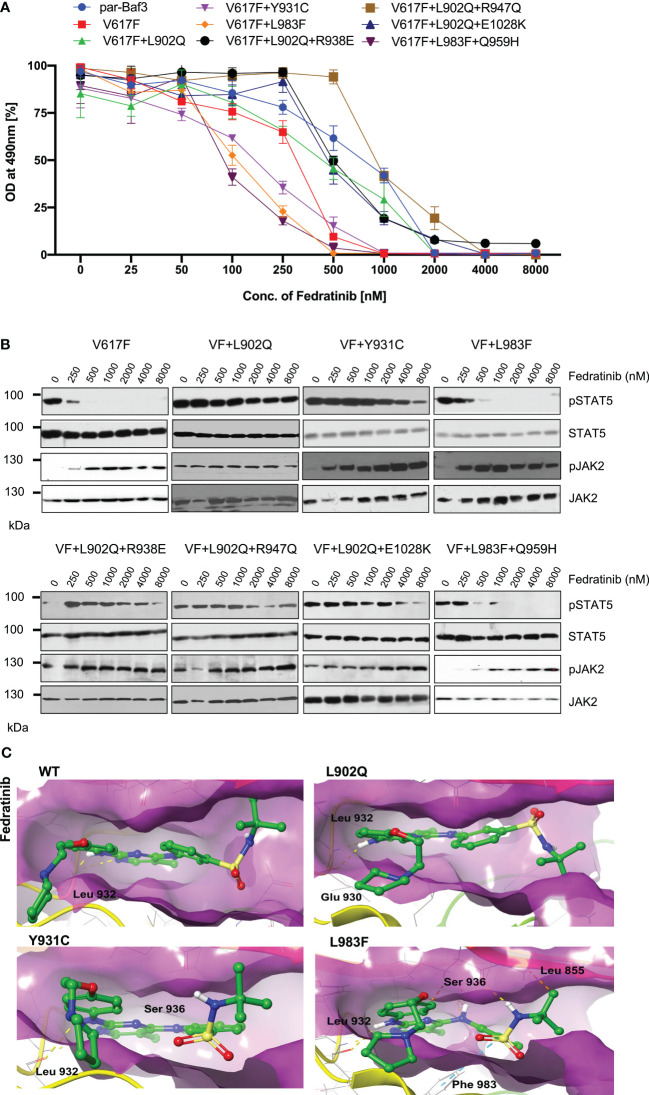
Figure 4.
L983F and Y931C display sensitivity towards fedratinib: Mutations that emerged in the ruxolitinib screen were reengineered and expressed in the Ba/F3 cells. Cells were incubated in the presence of fedratinib. Proliferation was measured using 3-(4,5-dimethylthiazol-2-yl)-5-(3-carboxymethoxyphenyl)-2-(4-sulfophenyl)-2h-tetrazolium (MTS)- based method after incubation for 48hrs in the presence of increasing concentration of the inhibitor fedratinib (A). Data is shown as mean ± standard deviation (SD) (n=3). OD – optical density. Immunoblot analysis of Ba/F3 cells expressing JAK2 mutants cultured with increasing concentrations of fedratinib (0, 250, 500, 1000, 2000, 4000 and 8000nM) for 4hrs and lysates were subjected to indicated antibodies (B). A representative image of n=2 two independent experiments is shown. Molecular docking studies were performed using the Glide package of Schrodinger maestro software. The binding interactions of fedratinib (stick representation in green carbon) with the JAK2 Kinase domain and its mutants (secondary structure representation as a cartoon) are displayed. Hydrogen bonds are represented by dotted yellow lines, carbon centered hydrogen bonds are represented by dotted orange lines, pi-pi interactions are represented by dotted cyan lines and the amino acids responsible for these interactions are labelled in black. The binding interactions of fedratinib with wild type JAK2, L902Q, Y931C and L983F (C).

